Terahertz ATR Measurement of Liquids by Vacuum FTIR
January 4, 2024
 Download This Application
Introduction
The far-infrared region is also referred to as the terahertz region and is characterized by wavelengths longer than the mid-infrared region. In recent years, far-IR spectroscopy has been used to evaluate semiconductor materials and crystal polymorphism in pharmaceuticals , as well as for archaeological research applications, including the study of inorganic pigments. Light in the far-infrared region (terahertz waves) corresponds to hydrogen bonding and Van der Waals forces believed to hold the key to an understanding of the functional expressions of, and structural changes in biological molecules in liquids, as well as absorption energy in hydrophobic interactions. Theoretical calculations have been applied in the past, , but the data from actual measurement in the far IR region should allow the acquisition of important experimental information regarding these phenomena.
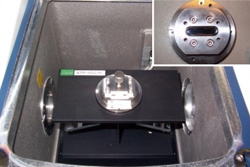
Transmission measurement is commonly used in the far-infrared region but is not suitable for samples with significant absorption. For measurements of liquid samples such as biological molecules in aqueous solution, cell path lengths must be reduced to 10 um or less to avoid the effects of solvent absorption. This makes it difficult to directly measure gel-state materials or biological samples, such as protein solutions. ATR measurement uses IR light focused through a crystalline prism that allows the beam to penetrate slightly into a sample in intimate contact with the surface. This method allows easy measurements of samples with efficient contact characteristics, such as liquids and gels. The effects of moisture vapor are more pronounced in the far-infrared region than in the mid-infrared region, but this can be eliminated by evacuating the interferometer and sample chamber to reduce the effects of the water bands. However, depressurizing the sample chamber causes liquid samples to quickly vaporize making ATR measurement more challenging. The sampling area of the ATR-500/Mi triple-reflection ATR crystal plate can be sealed around the ATR crystal to prevent liquids from vaporizing when used in an evacuated sample chamber for measurement in the THz region. The Si prism used in the ATR has a penetration depth of approximately 2 um at 1000 cm-1 and 10 um at 200 cm-1 .
To verify the relationship between hydration and ions in various aqueous electrolyte solutions, Far-IR ATR measurements of pure water and various salt water solutions were performed using an FT/IR- 6300FV full vacuum spectrometer with a liquid triple-reflection ATR. The results of these measurements are outlined below.
Experimental
- System:
- FT/IR-6300FV Measurement
- Method: ATR method (Triple-reflection)
- Resolution: 2 cm-1
- Accumulations: 128
- Accessory: ATR-500/Mi + liquid triple-reflection ATR crystal plate (for Far-IR)
- Sample: pure water, 2 or 5 mol/L- Sodium chloride and Potassium chloride solution, 2 mol/L- Calcium chloride solution
Keywords
140-AT-0221
Results
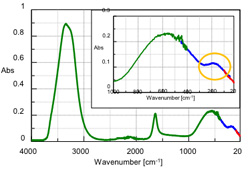
ATR measurements were performed of pure water in the mid-infrared and far-infrared regions. The results obtained by applying ATR corrections to the measured spectra are shown in Figure 2. The measurement conditions are given in Table 1. As shown in Table 1, the FT/IR-6000 series allows changes in the light source and beam splitter based on measurement frequency, enabling measurements across a broad spectral range. A peak near 600 cm-1 potentially assigned to the absorption resulting from the intermolecular motion of water is shown in Figure 2. Another peak was observed near 180 cm-1 (yellow border in Figure 2), which is assigned to hydrogen bonding. The change in the behavior of the peak near 180 cm-1 resulting from the solute type was also measured.
Table 1: Measurement Conditions for Mid-IR and Far-IR region
| Wavenumber [cm-1] | Beam splitter | Light source | Detector |
|---|---|---|---|
| 4000 - 400 *1(green-line) | Ge/KBr | High-intensity ceramic source | DLaTGS (standard) |
| 450 - 100 *2 (blue-line) | 5 µm Mylar | High-intensity ceramic source | Si bolometer (option) |
| 110 - 20 (red-line) | 25 µm Mylar | Water-cooled mercury light source |
*1 The ATR PRO470-H (diamond prism) was used at atmospheric pressure.
*2 The S/N ratio is lower in the frequency range below 150 cm-1
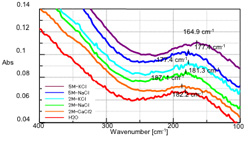
The stack graph (Figure 3) shows the ATR spectra of these aqueous solutions near 180 cm-1. Table 2 and Fig. 3 indicate the positions of the peaks assigned to hydrogen bonding. In all cases, the monovalent cation shifts toward the low frequency side compared to water, indicating a correlation between density and shift width. In the Potassium solution (K+) the large ion radius shifts the peak significantly toward the low frequency side, as compared to the Sodium solution (Na+). In an aqueous solution containing Calcium (Ca2+), a bivalent cation, the peak shifts toward the high frequency side compared to water alone, behavior opposite that of the monovalent cation. This suggests that the ionic radius, electrical charge, and water solution activity affect the hydrogen bonding energy
Table 2: Peak Shift of Each Sample
| Sample (Valence) | Ion radius [nm] | Conc. [mol/L] | Peak top [cm-1] | Peak shift [cm-1] |
|---|---|---|---|---|
| H2O | - | - | 182.2 | - |
| CaCl2aq (+2) | 0.114 | 2.0 | 187.1 | +4.9 |
| NaClaq (+1) | 0.116 | 2.0 | 181.3 | -0.9 |
| 5.0 | 177.4 | -4.8 | ||
| KClaq (+1) | 0.152 | 2.0 | 177.4 | -4.8 |
| 5.0 | 164.9 | -17.3 |
Conclusion
As described above, using a liquid ATR accessory for measurements of solutions in a vacuum in the far-infrared region was confirmed to be highly effective in detecting slight changes in the behavior of aqueous solutions. Since significant differences between Na+and K+ were verified in the measurements, we believe the liquid ATR accessory designed for the Far-IR region should find applications not just in the analysis of hydrogen bonding and intermolecular forces, but also the functions of and structural changes in molecules in solution, but for elucidating phenomena within biological organisms.
Featured Products:
-

Compact fixed range mid-IR spectrometer with options to extend to the NIR/FIR
FT/IR-4X
-

Spectra Manager™

Terahertz ATR Measurement of Liquids by Vacuum FTIR
Introduction
The far-infrared region is also referred to as the terahertz region and is characterized by wavelengths longer than the mid-infrared region. In recent years, far-IR spectroscopy has been used to evaluate semiconductor materials and crystal polymorphism in pharmaceuticals , as well as for archaeological research applications, including the study of inorganic pigments. Light in the far-infrared region (terahertz waves) corresponds to hydrogen bonding and Van der Waals forces believed to hold the key to an understanding of the functional expressions of, and structural changes in biological molecules in liquids, as well as absorption energy in hydrophobic interactions. Theoretical calculations have been applied in the past, , but the data from actual measurement in the far IR region should allow the acquisition of important experimental information regarding these phenomena.
Transmission measurement is commonly used in the far-infrared region but is not suitable for samples with significant absorption. For measurements of liquid samples such as biological molecules in aqueous solution, cell path lengths must be reduced to 10 um or less to avoid the effects of solvent absorption. This makes it difficult to directly measure gel-state materials or biological samples, such as protein solutions. ATR measurement uses IR light focused through a crystalline prism that allows the beam to penetrate slightly into a sample in intimate contact with the surface. This method allows easy measurements of samples with efficient contact characteristics, such as liquids and gels. The effects of moisture vapor are more pronounced in the far-infrared region than in the mid-infrared region, but this can be eliminated by evacuating the interferometer and sample chamber to reduce the effects of the water bands. However, depressurizing the sample chamber causes liquid samples to quickly vaporize making ATR measurement more challenging. The sampling area of the ATR-500/Mi triple-reflection ATR crystal plate can be sealed around the ATR crystal to prevent liquids from vaporizing when used in an evacuated sample chamber for measurement in the THz region. The Si prism used in the ATR has a penetration depth of approximately 2 um at 1000 cm-1 and 10 um at 200 cm-1 .
To verify the relationship between hydration and ions in various aqueous electrolyte solutions, Far-IR ATR measurements of pure water and various salt water solutions were performed using an FT/IR- 6300FV full vacuum spectrometer with a liquid triple-reflection ATR. The results of these measurements are outlined below.
Experimental
- System:
- FT/IR-6300FV Measurement
- Method: ATR method (Triple-reflection)
- Resolution: 2 cm-1
- Accumulations: 128
- Accessory: ATR-500/Mi + liquid triple-reflection ATR crystal plate (for Far-IR)
- Sample: pure water, 2 or 5 mol/L- Sodium chloride and Potassium chloride solution, 2 mol/L- Calcium chloride solution
Results
ATR measurements were performed of pure water in the mid-infrared and far-infrared regions. The results obtained by applying ATR corrections to the measured spectra are shown in Figure 2. The measurement conditions are given in Table 1. As shown in Table 1, the FT/IR-6000 series allows changes in the light source and beam splitter based on measurement frequency, enabling measurements across a broad spectral range. A peak near 600 cm-1 potentially assigned to the absorption resulting from the intermolecular motion of water is shown in Figure 2. Another peak was observed near 180 cm-1 (yellow border in Figure 2), which is assigned to hydrogen bonding. The change in the behavior of the peak near 180 cm-1 resulting from the solute type was also measured.
Table 1: Measurement Conditions for Mid-IR and Far-IR region
| Wavenumber [cm-1] | Beam splitter | Light source | Detector |
|---|---|---|---|
| 4000 - 400 *1(green-line) | Ge/KBr | High-intensity ceramic source | DLaTGS (standard) |
| 450 - 100 *2 (blue-line) | 5 µm Mylar | High-intensity ceramic source | Si bolometer (option) |
| 110 - 20 (red-line) | 25 µm Mylar | Water-cooled mercury light source |
*1 The ATR PRO470-H (diamond prism) was used at atmospheric pressure.
*2 The S/N ratio is lower in the frequency range below 150 cm-1
The stack graph (Figure 3) shows the ATR spectra of these aqueous solutions near 180 cm-1. Table 2 and Fig. 3 indicate the positions of the peaks assigned to hydrogen bonding. In all cases, the monovalent cation shifts toward the low frequency side compared to water, indicating a correlation between density and shift width. In the Potassium solution (K+) the large ion radius shifts the peak significantly toward the low frequency side, as compared to the Sodium solution (Na+). In an aqueous solution containing Calcium (Ca2+), a bivalent cation, the peak shifts toward the high frequency side compared to water alone, behavior opposite that of the monovalent cation. This suggests that the ionic radius, electrical charge, and water solution activity affect the hydrogen bonding energy
Table 2: Peak Shift of Each Sample
| Sample (Valence) | Ion radius [nm] | Conc. [mol/L] | Peak top [cm-1] | Peak shift [cm-1] |
|---|---|---|---|---|
| H2O | - | - | 182.2 | - |
| CaCl2aq (+2) | 0.114 | 2.0 | 187.1 | +4.9 |
| NaClaq (+1) | 0.116 | 2.0 | 181.3 | -0.9 |
| 5.0 | 177.4 | -4.8 | ||
| KClaq (+1) | 0.152 | 2.0 | 177.4 | -4.8 |
| 5.0 | 164.9 | -17.3 |
Conclusion
As described above, using a liquid ATR accessory for measurements of solutions in a vacuum in the far-infrared region was confirmed to be highly effective in detecting slight changes in the behavior of aqueous solutions. Since significant differences between Na+and K+ were verified in the measurements, we believe the liquid ATR accessory designed for the Far-IR region should find applications not just in the analysis of hydrogen bonding and intermolecular forces, but also the functions of and structural changes in molecules in solution, but for elucidating phenomena within biological organisms.
Keywords
140-AT-0221