
A spectrophotometer is an analytical instrument that measures how much light a sample absorbs or transmits at selected wavelengths. By comparing the light entering a sample with the light leaving it, the instrument can help identify light-absorbing substances and determine their concentration. The quantitative relationship behind many absorbance measurements is the Beer-Lambert law, A = εcl, which relates absorbance to molar absorptivity, concentration, and optical path length.
Spectrophotometry is used from teaching laboratories to pharmaceutical quality control because it converts a simple interaction between light and matter into reproducible chemical information. This article explains how a spectrophotometer works, where the technique came from, and how spectrophotometers differ from spectrometers and colorimeters. JASCO’s own history also begins with spectroscopy instrumentation: the company was founded in 1958 after Japanese researchers developed an infrared spectrophotometer when a suitable commercial instrument was not available domestically. Readers who want to see the current instrument family can explore JASCO UV-Vis/NIR spectrophotometers.
How a Spectrophotometer Works
The operating principle of a spectrophotometer is straightforward: light of a selected wavelength passes through, or in some configurations reflects from, a sample, and the instrument compares the intensity before and after that interaction. The difference is reported as transmittance or absorbance and can then be related to sample composition.
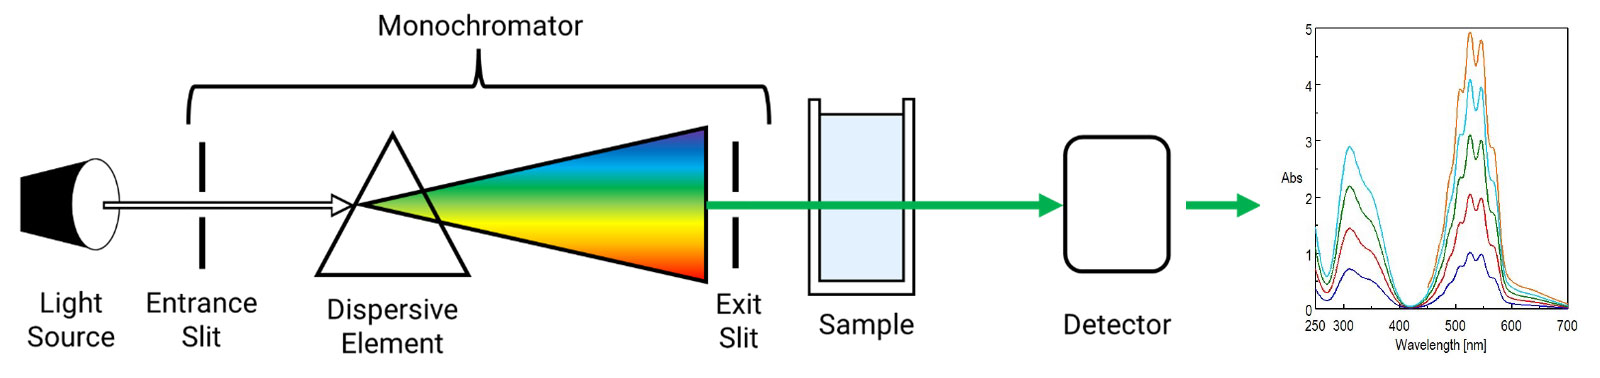
- Light source: provides radiation across the wavelength range of interest; UV-Visible/NIR instruments commonly use a deuterium lamp for the ultraviolet region and a tungsten/halogen lamp for the visible and near-infrared regions.
- Monochromator: uses a diffraction grating and optical slits to isolate a narrow wavelength band.
- Sample: interacts with the selected light, commonly in a cuvette with a defined optical path length.
- Detector: converts the emerging light into an electrical signal; common technologies include photomultiplier tubes or silicon photodiodes for UV/Visible measurements and PbS or InGaAs detectors for the NIR.
- Software/readout: calculates and displays absorbance, transmittance, concentration, or a complete spectrum.
For quantitative analysis, the Beer-Lambert law is often the key relationship: A = εcl. In plain terms, absorbance increases with the concentration of the absorbing species and with the optical path length, provided the measurement remains within the law’s useful range. Instrument architecture also matters. In a single-beam system, blank and sample measurements are made sequentially; a double-beam design compares sample and reference signals so changes such as lamp drift are minimized. Optical resolution is another trade-off: narrower monochromator slits can improve wavelength resolution, but they also reduce the amount of light reaching the detector. Double-monochromator designs are used when lower stray light and a wider accurate absorbance range are required.
For a deeper optical breakdown, see JASCO’s Instrumentation of a UV-Visible Spectrophotometer guide and the Theory of UV-Visible Spectroscopy for the Beer-Lambert derivation.
Where Spectrophotometry Came From
The science behind spectrophotometry is much older than the electronic instrument. In 1729, Pierre Bouguer described the attenuation of light as it passed through a medium. Johann Heinrich Lambert formalized the relationship between light attenuation and path length in his 1760 work Photometria, and August Beer added the relationship to concentration in 1852. Those contributions form the basis of what is now called the Beer-Lambert law.
The next important step was learning to separate light into wavelengths and use the resulting spectra to identify substances. In 1859-60, Robert Bunsen and Gustav Kirchhoff developed the spectroscope for examining flame spectra. Their work led to the discovery of cesium in 1860 and rubidium in 1861, demonstrating how optical spectra could reveal what a sample contained. The approach was powerful for identification, but it was not yet the modern quantitative spectrophotometer.
| Year | Who | What Changed |
|---|---|---|
| 1729 | Pierre Bouguer | Described attenuation of light through a medium. |
| 1760 | J. H. Lambert | Formalized the relationship between attenuation and path length. |
| 1852 | August Beer | Related absorbance behavior to concentration. |
| 1859-60 | Bunsen & Kirchhoff | Developed spectroscopic analysis of flame spectra. |
| 1940-41 | Beckman / Cary | Developed the UV-capable DU spectrophotometer. |
| 1979 | Hewlett-Packard | Introduced the HP 8450A diode-array spectrophotometer. |
Practical ultraviolet spectrophotometry arrived in the 1940s. At National Technical Laboratories, Arnold O. Beckman’s team, led by Howard H. Cary, developed the DU spectrophotometer in 1940-41, extending reliable measurement into the ultraviolet. A later shift came in 1979 with Hewlett-Packard’s HP 8450A, described in the content brief as the first commercially available diode-array spectrophotometer, which could collect a full spectrum in seconds rather than mechanically stepping through wavelengths one at a time. Today’s instruments are far more automated and sensitive, but the fundamental measurement still rests on the relationships described by Bouguer, Lambert, and Beer long before electronic spectroscopy existed.
For historical context, the publication can link to the Beckman Foundation account of the spectrophotometer and the Journal of Biological Chemistry retrospective, A Classic Instrument.
JASCO’s Place in the Story
JASCO’s place in this history is distinctive because spectroscopy was not a later product expansion; it was the company’s starting point. In the mid-1950s, researchers at the Institute of Optics in Japan needed an infrared spectrophotometer for their work, but a suitable commercial instrument was not available in Japan. They built an instrument themselves, and demand from other research groups for similar systems led to the founding of the Japan Spectroscopic Company in 1958.
That origin also explains the name JASCO and the breadth of the company’s later molecular-spectroscopy portfolio. From infrared spectroscopy, the product range expanded to UV-Visible/NIR absorption spectroscopy, fluorescence, circular dichroism, Raman, and FTIR instrumentation. Chromatography was introduced later, in the early 1970s, reinforcing that spectroscopy was the founding discipline rather than a secondary business line.
The same lineage continues in JASCO’s current UV-Visible/NIR platform. The V-700 Series spans applications from far-UV measurement to the near-infrared, with the product family covering approximately 187 nm to 3,200 nm across five models. Modern instruments add automated wavelength control, digital data handling, advanced detectors, accessories, and application software, but their central task remains the same: control light precisely, measure how a sample changes it, and convert that change into useful analytical information.
The fuller company background is available in A Brief History of JASCO.
Spectrophotometer vs. Spectrometer vs. Colorimeter
Spectrometer, spectrophotometer, and colorimeter are often used as if they were interchangeable, but they describe different levels of measurement. A spectrometer is the broadest term: it separates electromagnetic radiation by wavelength and measures signal intensity across a spectrum. A spectrophotometer is a spectrometer designed specifically to compare the intensity of light before and after it interacts with a sample so that absorbance or transmittance can be calculated. A colorimeter is generally a simpler instrument that measures at a small number of fixed wavelength bands, often using optical filters rather than scanning a continuous range with a monochromator.
| Instrument | What it measures / how | Typical use |
|---|---|---|
| Spectrometer | Measures signal intensity as a function of wavelength; broad umbrella term. | Spectral characterization and wavelength-resolved measurement. |
| Spectrophotometer | Compares light before and after interaction with a sample to calculate absorbance or transmittance. | Quantitation, full absorption spectra, kinetics, research, and QC. |
| Colorimeter | Measures a limited set of wavelength bands, often with fixed optical filters. | Routine colorimetric checks or established single-/few-wavelength methods. |
The practical distinction depends on the question being asked. If the goal is to collect a full absorption spectrum, choose an exact analytical wavelength, distinguish overlapping features, or investigate an unknown sample, a spectrophotometer or research-grade spectrometer is appropriate. If a routine method needs only one or two established wavelength bands, a colorimeter can be sufficient and typically simpler. The boundaries are not absolute: a full UV-Visible spectrophotometer can also perform color analysis, including chromaticity and L*a*b* calculations, when equipped with suitable software and accessories. JASCO provides an application example in Color Analysis using a UV-Visible Spectrophotometer.
What Labs Use a Spectrophotometer For
Spectrophotometers are used wherever the absorption or transmission of light provides information about composition, concentration, purity, color, or change over time. Common settings include pharmaceutical quality control and stability testing, biochemistry and molecular biology, food and beverage analysis, environmental laboratories, materials research, and color measurement.
In life-science laboratories, UV absorbance can be used for nucleic-acid and protein concentration checks, while color-forming assays extend the technique to many other analytes. JASCO’s application materials, for example, describe protein quantitation by direct UV absorption at 280 nm as well as Biuret, Lowry, BCA, Bradford, and WST methods. Protein Quantitation using a UV-Visible Spectrophotometer provides a concrete example. Spectrophotometers can also quantify color through chromaticity and L*a*b* values. The best optical configuration depends on the sample: wavelength range, detector technology, sample holder, path length, and accessories should follow the analyte and the measurement objective rather than a one-size-fits-all instrument specification.
Frequently Asked Questions
These short answers address common questions from students, laboratory users, and buyers evaluating spectrophotometry for the first time.
What is a spectrophotometer used for?
A spectrophotometer measures how much light a sample absorbs or transmits at selected wavelengths so the user can identify or quantify substances in the sample. Typical applications include pharmaceutical QC, protein and nucleic-acid measurements, food and beverage analysis, environmental testing, materials research, reaction monitoring, and objective color or chromaticity analysis.
Who invented the spectrophotometer?
Arnold O. Beckman’s team at National Technical Laboratories, led by Howard H. Cary, developed the first practical UV-capable commercial spectrophotometer, the DU, in 1940-41. The science it used was much older: Bouguer, Lambert, and Beer had described the relationships among light attenuation, path length, and concentration over the preceding two centuries.
What is the difference between a spectrophotometer and a spectrometer?
A spectrometer is the general term for an instrument that separates radiation by wavelength and measures intensity across a spectrum. A spectrophotometer is a type of spectrometer designed to compare light before and after it interacts with a sample, allowing the instrument to calculate absorbance or transmittance and support quantitative analysis.
What is the difference between a spectrophotometer and a colorimeter?
A colorimeter usually measures light at a limited number of fixed wavelength bands, often with optical filters. A spectrophotometer can select or scan wavelengths across a continuous range using a monochromator, making it more flexible for full spectra, quantitative assays, unknown samples, and research applications. Many spectrophotometers can also perform color analysis.
How much does a spectrophotometer cost?
Spectrophotometer cost depends on the wavelength range, optical design, detector configuration, resolution, sampling accessories, automation, software, and regulatory requirements. A routine benchtop system and a research-grade double-monochromator UV-Visible/NIR system therefore fall into very different price categories. The most useful comparison is an application-specific configuration rather than a single generic price.
Choosing a spectrophotometer for your application?
Explore the JASCO V-700 Series to find the configuration that best matches your required wavelength range, optical performance, detector technology, sample handling, and accessories. Contact JASCO to discuss your application and identify the most appropriate system configuration.