Carbon Nanotube Analysis by Raman Spectroscopy
August 18, 2022
 Download This Application
Introduction
Carbon nanotubes are unique nanostructures with remarkable electronic and mechanical properties. Nanotubes have been considered prototypes for a one-dimensional quantum wire. As other useful properties have been discovered, particularly strength, interest has grown in potential applications, such as, nanometer-sized electronics or stronger polymer materials. Theory suggests that carbon nanotubes will have a variety of useful properties. Experiments validating this is just beginning. One primary method for the analysis of these nanostructures is raman microspectroscopy.
Carbon nanotubes are fullerene-type structures which consist of graphene cylinders closed at either end. A nanotube can be thought of as a hexagonal network of carbon atoms that has been rolled up to make a seamless cylinder. Nanometer across, the cylinder can be tens of microns long, with each end “capped” with half a fullerene molecule. Studies have predicted that nanotubes can be conducting or insulating depending on their structure, which leads to applications in electronics. They also suggest that nanotubes should be immensely strong, becoming “the ultimate carbon fibers”. Single-walled tubes have remarkable adsorptive and catalytic properties, and can be used as components of a new generation of fuel cells. This molecular nature is unprecedented for devices of this size. The challenge exists to find a method capable of finding these tiny particles and non-destructively analyze them for structural composition. Raman microspectroscopy is capable of doing that and more.
Experimental
Nanotube coated glass slides and nanotube granules were synthesized by various laboratories and submitted for analysis. They were imaged using the 20x objective under the microscope and the Raman collected using the Ventuno Raman system. Several areas of each sample were evaluated. The instrument was equipped with a 532 nm diode laser; 2 gratings and an air cooled CCD detector. The integration times for spectral collection were 20 seconds per acquisition. The confocal aperture used (50mm), gives an approximate 1mm (x,y) and 2mm (z) sample volume. The laser power at the sample was 10 mW or less.
Results
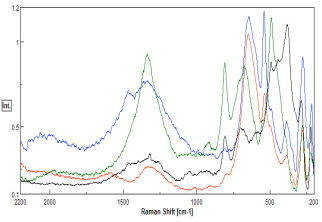
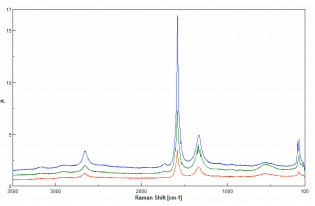
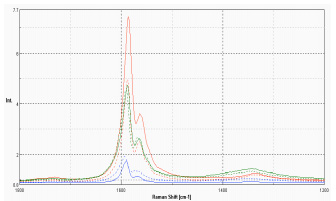
Figures 1-3 show various nanotube spectra. The spectra are being used with the permission of the researchers. The spectra indicate that the purity and structure of the nanotubes can be determined using the raman spectra. The spectra in Figures 1 and 3 were collected using both 532nm while Figure 2 was collected using 633nm excitation. Both excitation wavelengths appeared to be effective for analysis.
The primary concern in the analysis of the nanotubes was burning of the samples under prolonged laser exposure. The switching of the wavelengths was one method used to help reduce this effect. Additionally a laser attenuator was added to reduce the power on the sample and allow for longer collection times. Many of the nanotube samples were thin layers on microscope slides did not exhibit signs of burning. The more impure nanotube samples seemed to suffer the most from absorption of the laser.
Conclusion
Raman is an effective way to screen nanotubes that is reliable, non-destructive and requires little sample preparation.
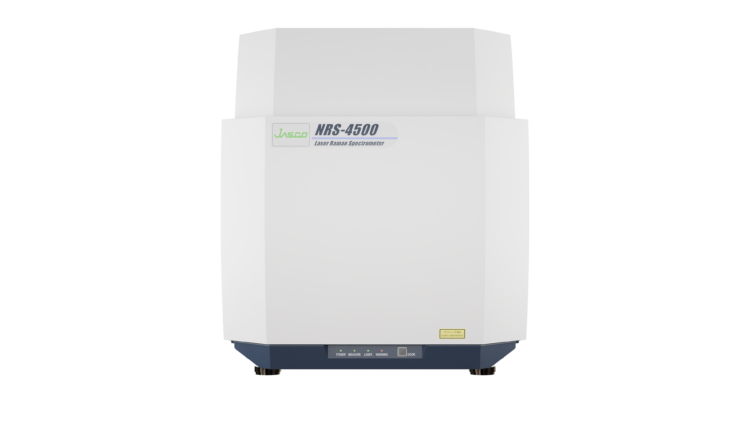
Featured Products:


Carbon Nanotube Analysis by Raman Spectroscopy
Introduction
Carbon nanotubes are unique nanostructures with remarkable electronic and mechanical properties. Nanotubes have been considered prototypes for a one-dimensional quantum wire. As other useful properties have been discovered, particularly strength, interest has grown in potential applications, such as, nanometer-sized electronics or stronger polymer materials. Theory suggests that carbon nanotubes will have a variety of useful properties. Experiments validating this is just beginning. One primary method for the analysis of these nanostructures is raman microspectroscopy.
Carbon nanotubes are fullerene-type structures which consist of graphene cylinders closed at either end. A nanotube can be thought of as a hexagonal network of carbon atoms that has been rolled up to make a seamless cylinder. Nanometer across, the cylinder can be tens of microns long, with each end “capped” with half a fullerene molecule. Studies have predicted that nanotubes can be conducting or insulating depending on their structure, which leads to applications in electronics. They also suggest that nanotubes should be immensely strong, becoming “the ultimate carbon fibers”. Single-walled tubes have remarkable adsorptive and catalytic properties, and can be used as components of a new generation of fuel cells. This molecular nature is unprecedented for devices of this size. The challenge exists to find a method capable of finding these tiny particles and non-destructively analyze them for structural composition. Raman microspectroscopy is capable of doing that and more.
Experimental
Nanotube coated glass slides and nanotube granules were synthesized by various laboratories and submitted for analysis. They were imaged using the 20x objective under the microscope and the Raman collected using the Ventuno Raman system. Several areas of each sample were evaluated. The instrument was equipped with a 532 nm diode laser; 2 gratings and an air cooled CCD detector. The integration times for spectral collection were 20 seconds per acquisition. The confocal aperture used (50mm), gives an approximate 1mm (x,y) and 2mm (z) sample volume. The laser power at the sample was 10 mW or less.
Results
Figures 1-3 show various nanotube spectra. The spectra are being used with the permission of the researchers. The spectra indicate that the purity and structure of the nanotubes can be determined using the raman spectra. The spectra in Figures 1 and 3 were collected using both 532nm while Figure 2 was collected using 633nm excitation. Both excitation wavelengths appeared to be effective for analysis.
The primary concern in the analysis of the nanotubes was burning of the samples under prolonged laser exposure. The switching of the wavelengths was one method used to help reduce this effect. Additionally a laser attenuator was added to reduce the power on the sample and allow for longer collection times. Many of the nanotube samples were thin layers on microscope slides did not exhibit signs of burning. The more impure nanotube samples seemed to suffer the most from absorption of the laser.
Conclusion
Raman is an effective way to screen nanotubes that is reliable, non-destructive and requires little sample preparation.