Analysis of Crystal Polymorphs for Pharmaceutical Development using Raman Spectroscopy
August 18, 2022
Introduction
Raman Analysis of Crystal Polymorphs
A crystal polymorph can be found where compounds with the same chemical formula can be crystallized into different structures. The crystal structure depends on the conditions (such as temperature and pressure) applied during the crystal formation process. The resulting crystal structures are conveniently classified as Form I, II, III or Ta and Tb .
In medicine, the solubility, stability and bio-availability will depend on the crystal polymorph; compounds with different crystal structures may even be recognized as different compounds. Therefore, research into crystal polymorphs is widely used in areas such as basic studies, structure/function correlation of compounds and industrial applications such as patent applications.
- Impurity Analysis (Identification of micro impurities – sizes less than 1 μm)
- Evaluation of Synthetized Compounds (Structural analysis in combination with IR)
- Mapping (Evaluation of tablets for DDS research)
- PAT (Real-time control in pharma production process)
The use of Raman as an alternative technique for the evaluation of crystal polymorphs (compared with XRD and DSC)
In the pharmaceutical industry, the study of crystal formation techniques is very important for the control of crystal structure and the manufacture of high-quality pharmaceuticals.
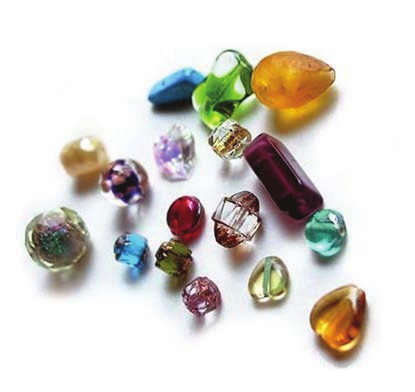
Methods for Evaluation of Crystal Polymorph
Three analytical techniques are used in the evaluation of crystal polymorph
| Instrument | Principle | Advantage | Disadvantage |
|---|---|---|---|
| XRD | Evaluation of crystal structure by X-ray diffraction. | Accurate distance between atoms in crystals. XRD is widely used for crystal structure analysis. | Amorphous structure cannot be evaluated by XRD. |
| DSC | Stability and melting point of crystals are evaluated by endothermic/exothermic reaction of the crystal when heating/cooling the sample | Properties of the crystal can be observed. | Crystal structure cannot be determined by DSC. |
| Raman | Chemical structure is evaluated by detecting scattering light at low wavenumbers derived from lattice vibration, by laser irradiation of the sample. | Both crystal and amorphous structures can be evaluated. Vibrational information of molecules can also be obtained from high wavenumber spectra. High spatial resolution and micro measurement can be done. Sample preparation is not required. | It is difficult for Raman to evaluate the absolute configuration of a crystal. |
Raman Spectroscopy is one of the hottest analytical techniques for the study of crystal polymorphs
Features of Raman Spectroscopy for Evaluating Crystal Polymorphs (vs. XRD)
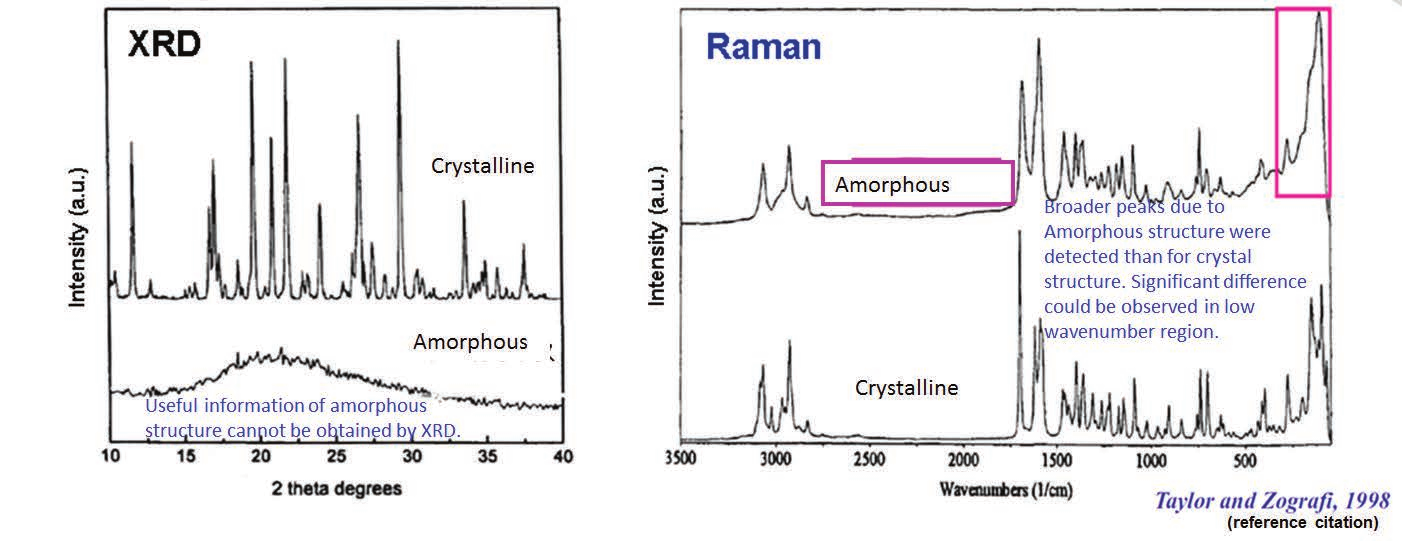
The above spectra show results for both crystalline and amorphous structures of Indometacin using XRD and Raman spectroscopy. Generally it is difficult to measure samples with less reflection (less diffraction spot) such as amorphous and/or minute crystals using X-ray crystal analysis. Since the actual compund formlation includes amorphous and minute crystals in the mixture, Raman spectroscopy is more effective as shown in the right figure. Presently X-Ray crystal analysis is used for the basic study of crystal structure for patent registration, however due to the above reasons, Raman is expected to become a more widely used technique in the pharmaceutical industries for patent registration.
Features of Raman Spectroscopy in Crystal Polymorph Evaluation (vs. DSC)
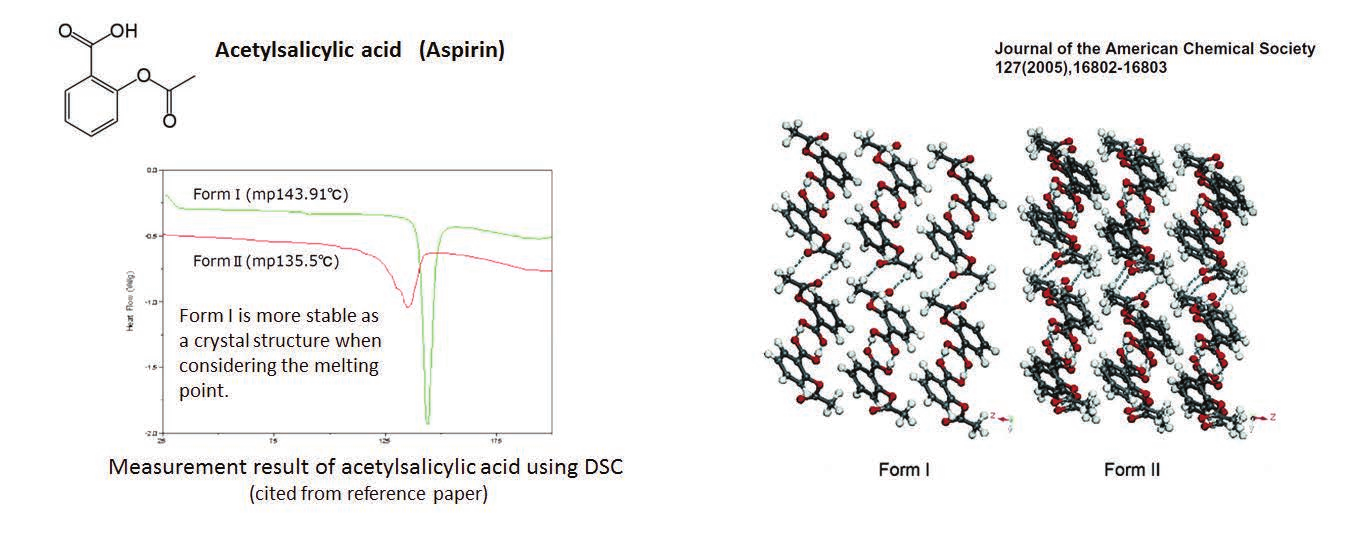
It is known that Acetylsalicylic acid can exists in crystalline Forms I and II. XRD can be used for crystal structure analysis, but thermal stability cannot be evaluated and useful spectra cannot be obtained for amorphous structures at temperatures higher than the melting point. Conversely, DSC can be used to evaluate the thermal stability of a crystal, but structural information cannot be obtained.
Raman spectra of Acetylsalicylic acid of different particle size
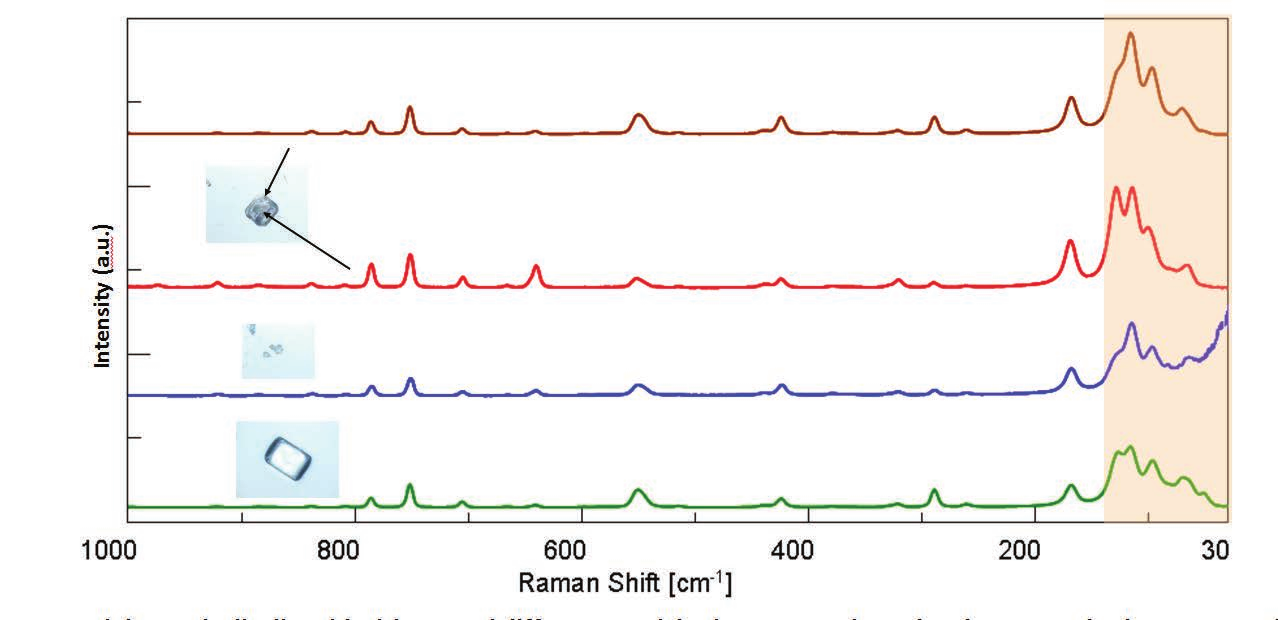
Commercial Acetylsalicylic acid with several different particle sizes were selected and measured using Raman. The results show a change in peak ratio observed in the higher wavenumber region, this is due to the differences in the crystal axis. In addition, differences in the Raman spectra were observed in the region below 200 cm-1 due to differences in particle size and measured position. These results indicates that the commercial medicine is in a mixed crystal state and it is therefore difficult to analyze using DSC due to the different melting points of the crystal forms.
NRS-5000 system with heating stage
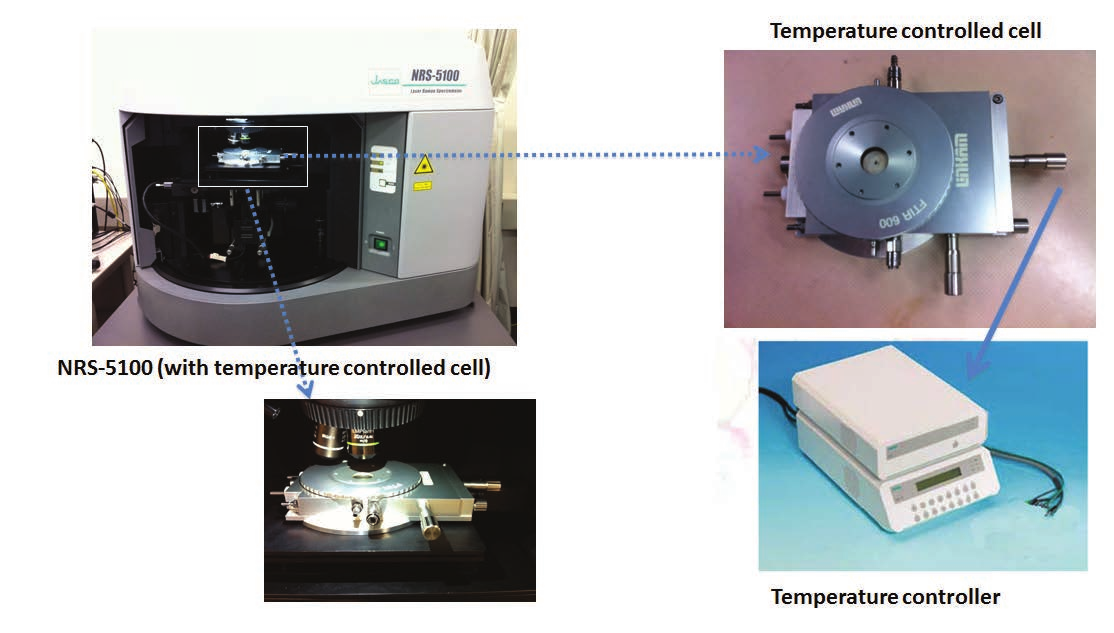
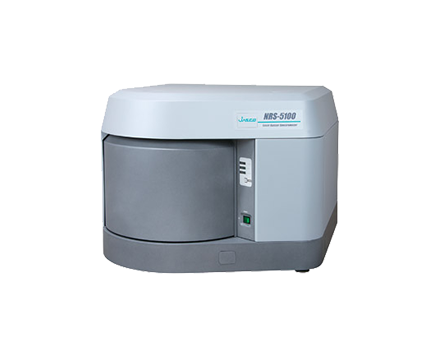
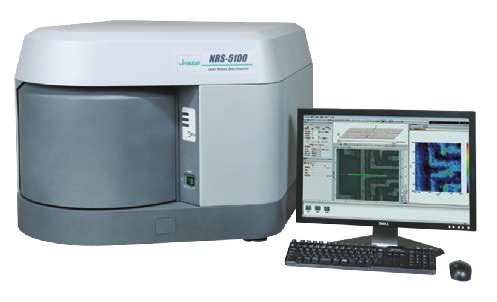
By mounting a temperature control system in the NRS-5000 series (or NRS-4100), it is possible to monitor in-situ the structural changes in samples.
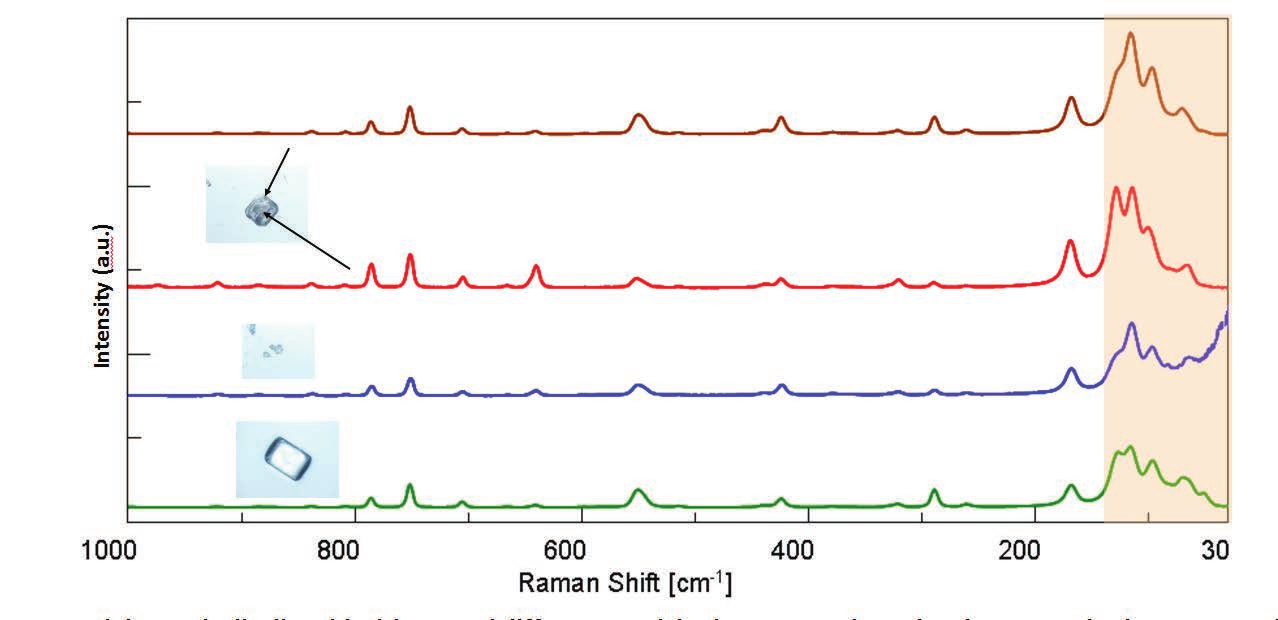
Commercial Acetylsalicylic acid with several different particle sizes were selected and measured using Raman. The results show a change in peak ratio observed in the higher wavenumber region, this is due to the differences in the crystal axis. In addition, differences in the Raman spectra were observed in the region below 200 cm-1 due to differences in particle size and measured position. These results indicates that the commercial medicine is in a mixed crystal state and it is therefore difficult to analyze using DSC due to the different melting points of the crystal forms.
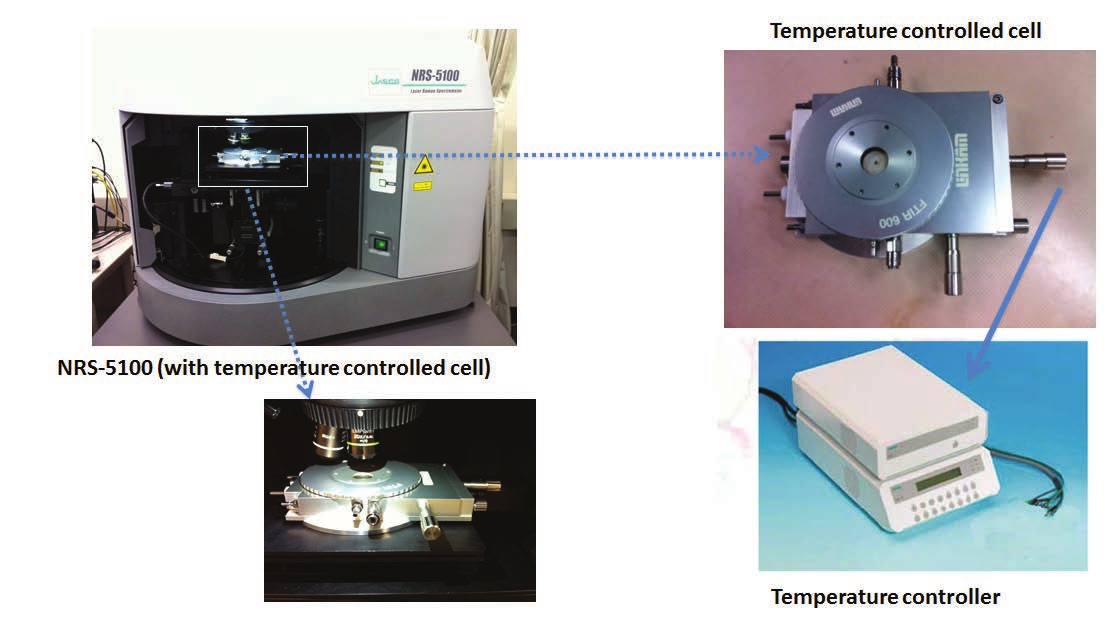
By mounting temperature control system on NRS-5000 series, it is possible to monitor in-situ the structural changes in samples.
Real-time Monitoring of Trehalose using a Heating Stage (1)
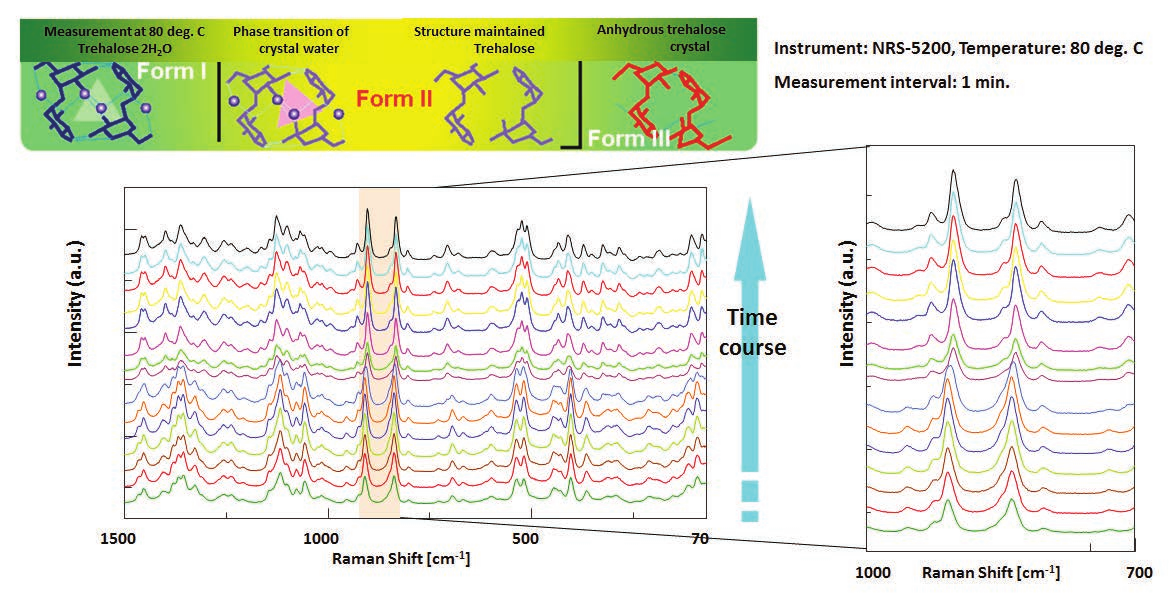
In-situ monitoring of Trehalose 2H2O (which has high water retention and is used for foods and medicines) at 80 deg. C – spectra measured at one minute intervals. The results shows time-dependent changes in the spectra.
Real-time Monitoring of Trehalose using a Heating Stage (2)
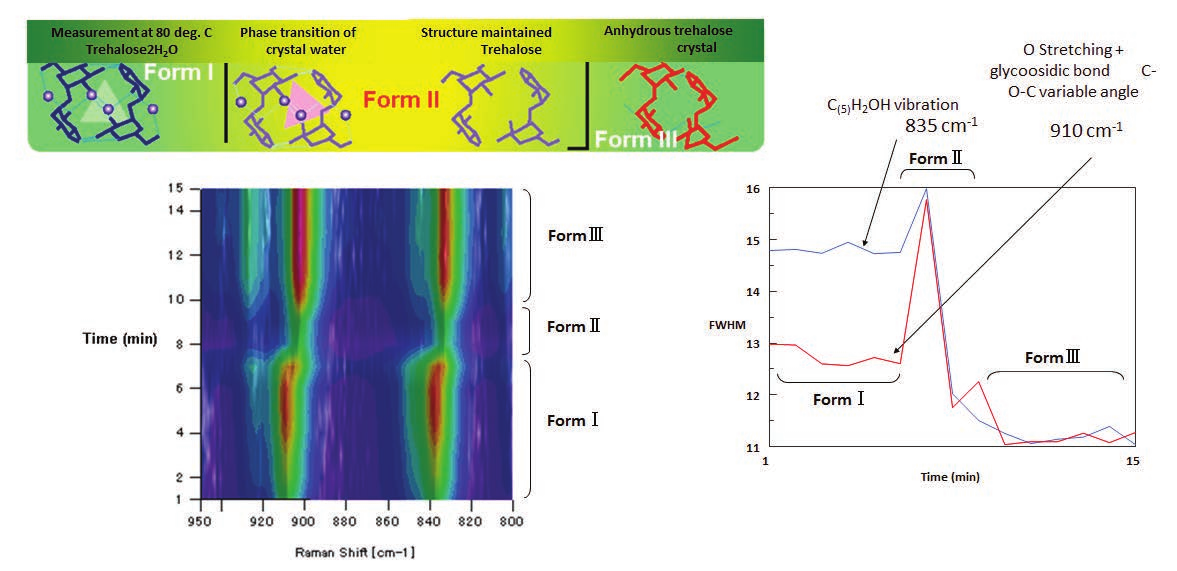
The half bandwidth and the peak shift of two peaks which demonstrate the hydration feature in the previous page were analyzed. The results indicate that the changing process of the peak shift and half bandwidth was observed in three steps and by analyzing peaks in the region 1000-700 cm-1. It was confirmed that the crystal structure of Trehalose changes from a pre-stable structure (crystal or Amorphous) to a stable structure. The combination of Raman fitted with a temperature control system enables the analysis of kinetic structural changes with sample melting.
Features of the NRS-5200 in the evaluation of crystal polymorphism
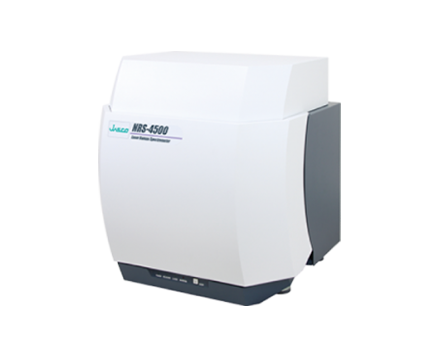
The above figure shows IR and Raman spectra of L-cystine. Raman spectroscopy enables measurement in the low wavenumber region below 400 cm -1 ; in addition, the NRS-5200 can provide information for the crystal lattice vibrations in the very low wavenumber region down to 10 cm -1 . Since Raman scattering from aqueous solutions or glass is weak, sample pretreatment is not necessary and samples in glass or aqueous samples can be measured easily and non-destructively. One of the features of the NRS-5000 is that crystal polymorphism can be evaluated quantitatively and qualitatively at a high spatial resolution down to ~1 μm.
Low Wavenumber Measurements using a Notch Filter
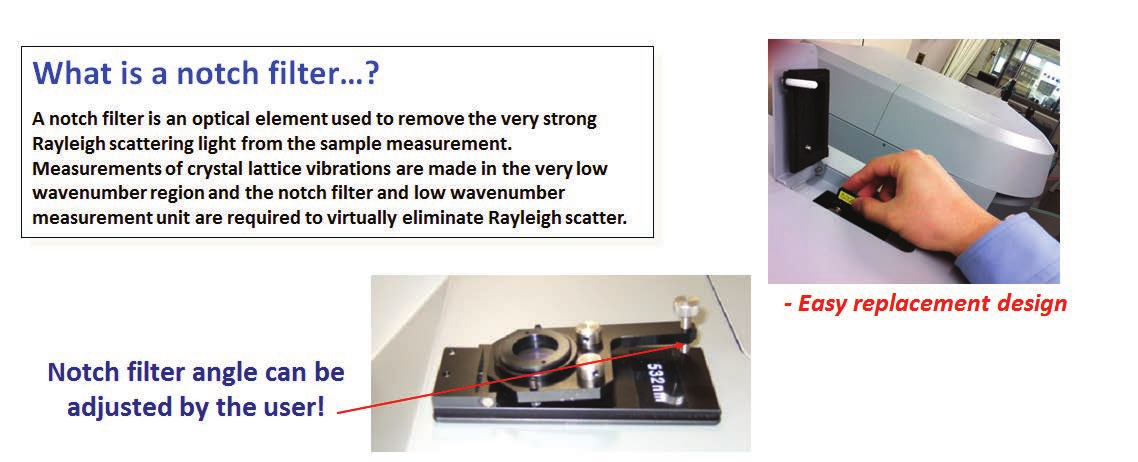
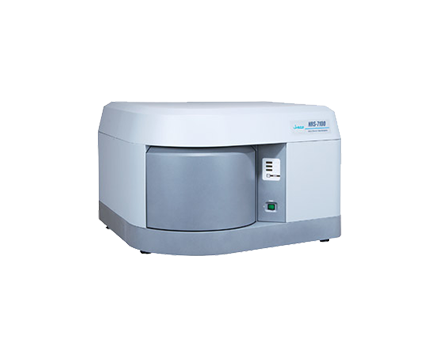
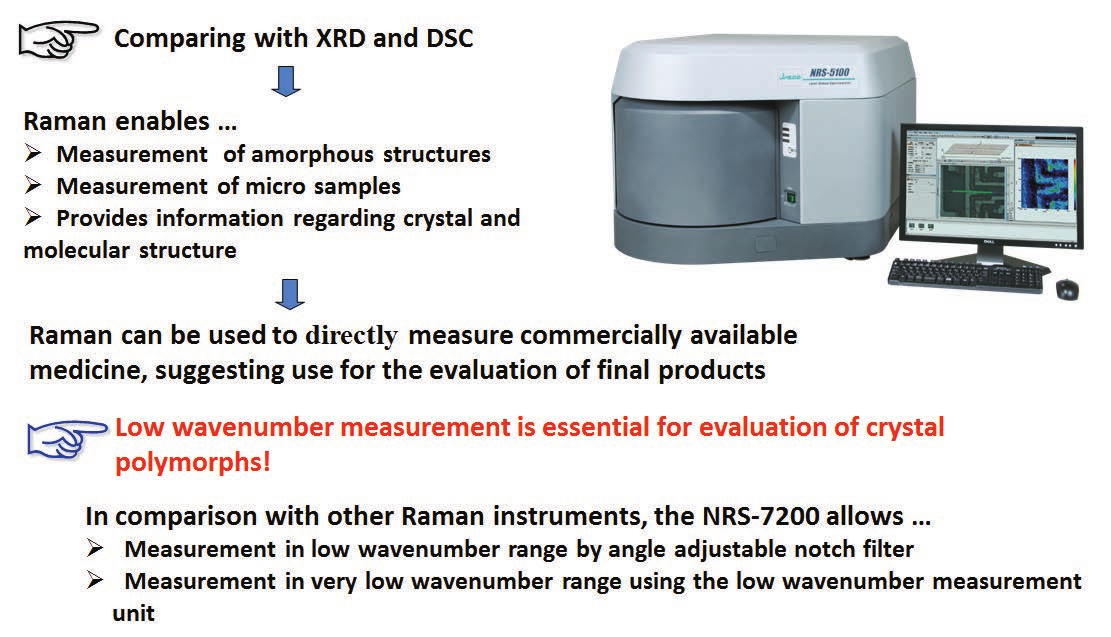
NRS-5000 series allows not only measurement of the usual inorganic and organic samples, but also measurement in the low wavenumber range using the most suitable optical arrangement. It is possible for the user to easily adjust the optimal angle of the notch filter for low wavenumber measurement as required for each sample. In addition, the NRS-7200 allows very low wavenumber measurement down to 5 cm -1 using the low wavenumber measurement unit.
| NRS-5100/7100 | : down to 50 cm-1 |
| NRS-5200 with low wavenumber measurement unit | : down to 10 cm-1 |
| NRS-7200 with low wavenumber measurement unit | : down to 5 cm-1 |
Low Wavenumber Measurement of Bismuth Oxide by Adjusting the Notch Filter Angle
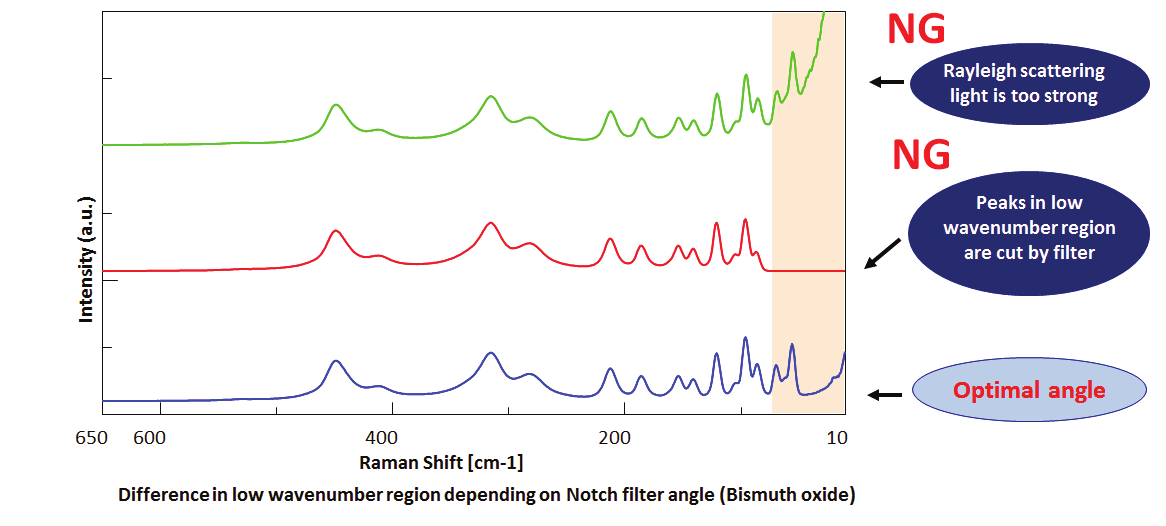
Since peaks of minerals or lattice vibration derived from crystals are detected in the low wavenumber region, Raman measurement in the low wavenumber region is very important. Rejection of Rayleigh scattering is the key point to detect peaks in the low wavenumber region, so careful optimization is necessary to adjust the angle of the notch filter depending on the sample requirements.
Low Wavenumber Measurement using a Notch Filter: Titanium Oxide with Crystal Polymorphs
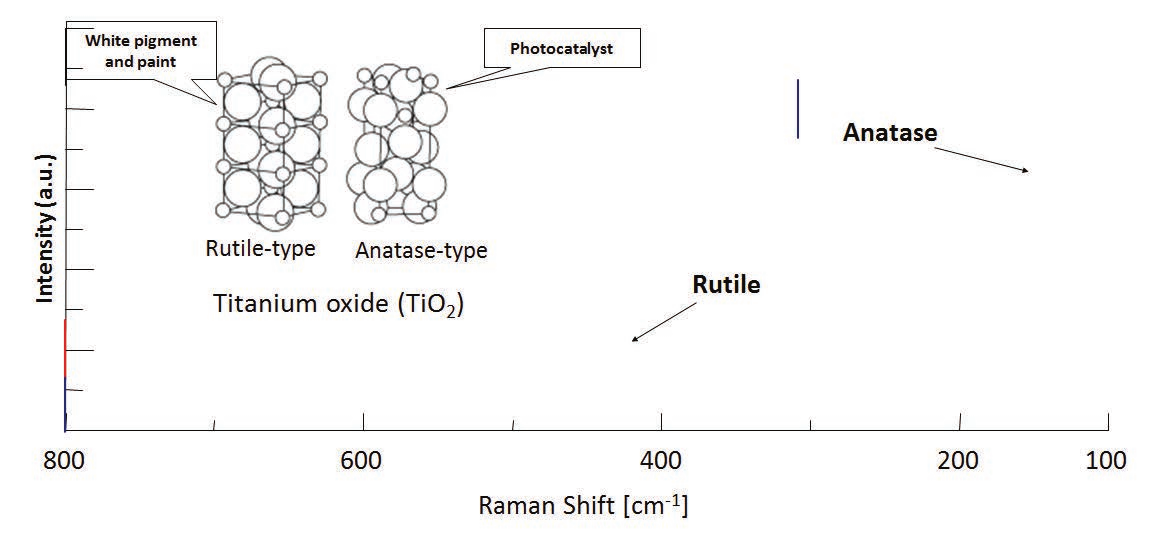
NRS-5000 series allows not only measurement of the usual inorganic and organic samples, but also measurement in the low wavenumber range using the most suitable optical arrangement. It is possible for the user to easily adjust the optimal angle of the notch filter for low wavenumber measurement as required for each sample. In addition the NRS-7200 allows very low wavenumber measurement down to 5 cm -1 using the low wavenumber measurement unit.
Measurement of Trehalose using the Low Wavenumber Measurement option on the NRS-7200
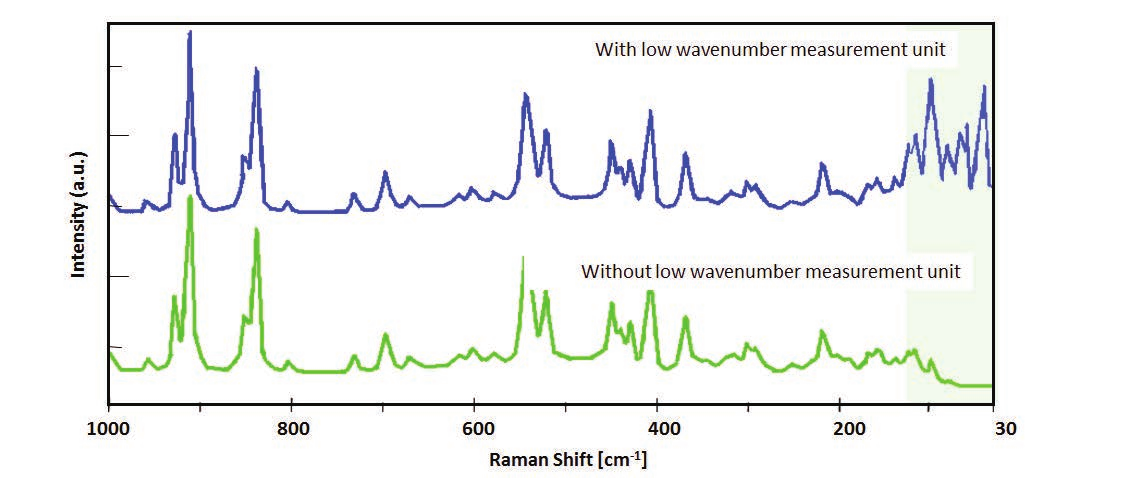
Sometimes important peaks are obscured by the notch filter when used with a single monochromator, however, the low wavenumber measurement unit fitted to the NRS-7200 enables clear measurements in the low wavenumber region.
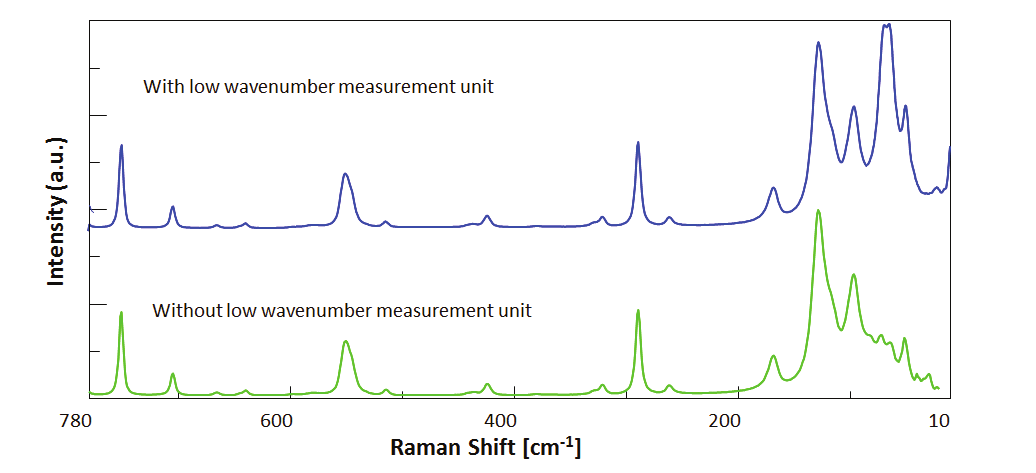
Acetylsalicylic acid was measured with the NRS-7200. The upper spectrum was obtained using the NRS-7200 fitted with a low wavenumber measurement unit, the lower spectrum, without using the option. Using the low wavenumber measurement unit, peaks for the lattice vibrations in the analgesic compound can be clearly observed and important information for crystal polymorph identification can be obtained.
Measurement of Carbamazepine Polymorphs using the NRS-7200 Low Wavenumber Measurement Unit
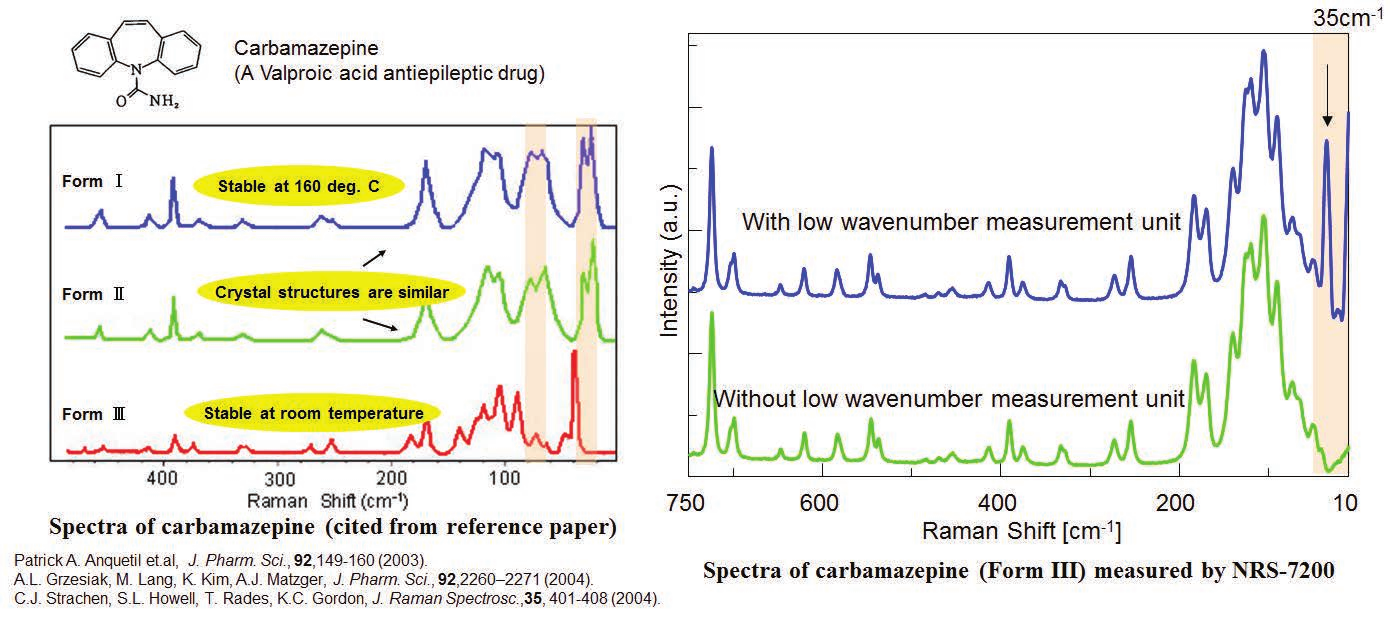
Since Raman spectroscopy can easily detect peaks in the wavenumber region below 100 cm -1 , it is possible to identify the differences between Forms I and II of carbamazepine whose crystal structures are quite similar. However, the low wavenumber measurement unit is required to characterize the Form III polymorph.
Measurement of Acetaminophen (Paracetamol) using the NRS-7200 Low Wavenumber Measurement Unit
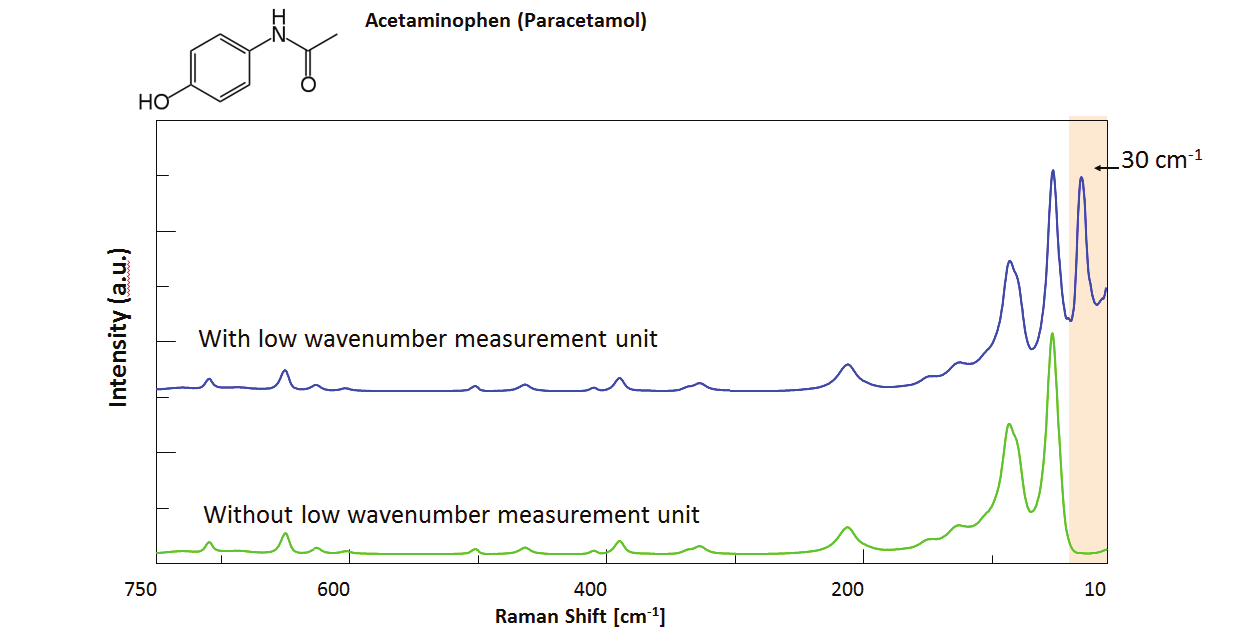
Commercially available Acetaminophen was measured using the NRS-7200. It is known that there are three crystal polymorphs of Paracetamol – Form I, II and III. The above spectra shows the Form I polymorph.
Measurement Indomethacin Polymorphs using the NRS-7200 Low Wavenumber Measurement Unit: Patent of Crystal Polymorphs
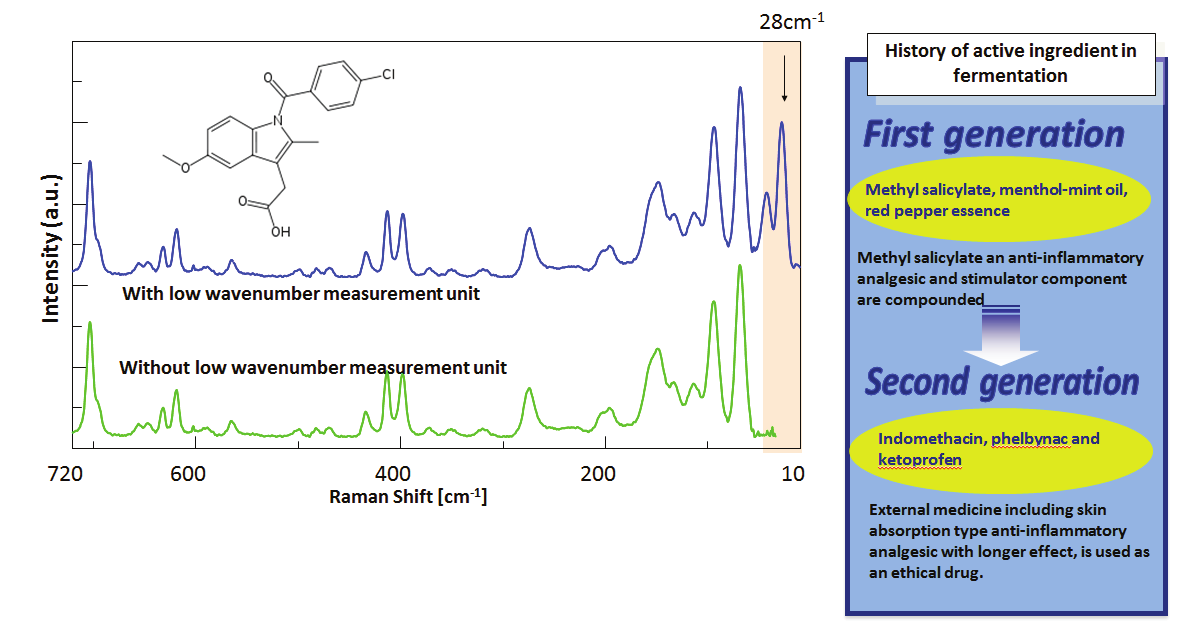
The above spectra were obtained by measuring commercially available Indomethacin using the NRS-7200 with and without the low wavenumber measurement unit. It is known that Indomethacin exists as three different crystal polymorphs: alpha (acicular crystal), beta and gamma (plate crystal). Gamma is the most stable structure followed by the alpha structure. Recently, alpha has been selectively manufactured (and patented) to be used for external medicine for enhanced skin absorption and stability. The method for effective manufacturing of a specified crystal polymorph is extremely important.
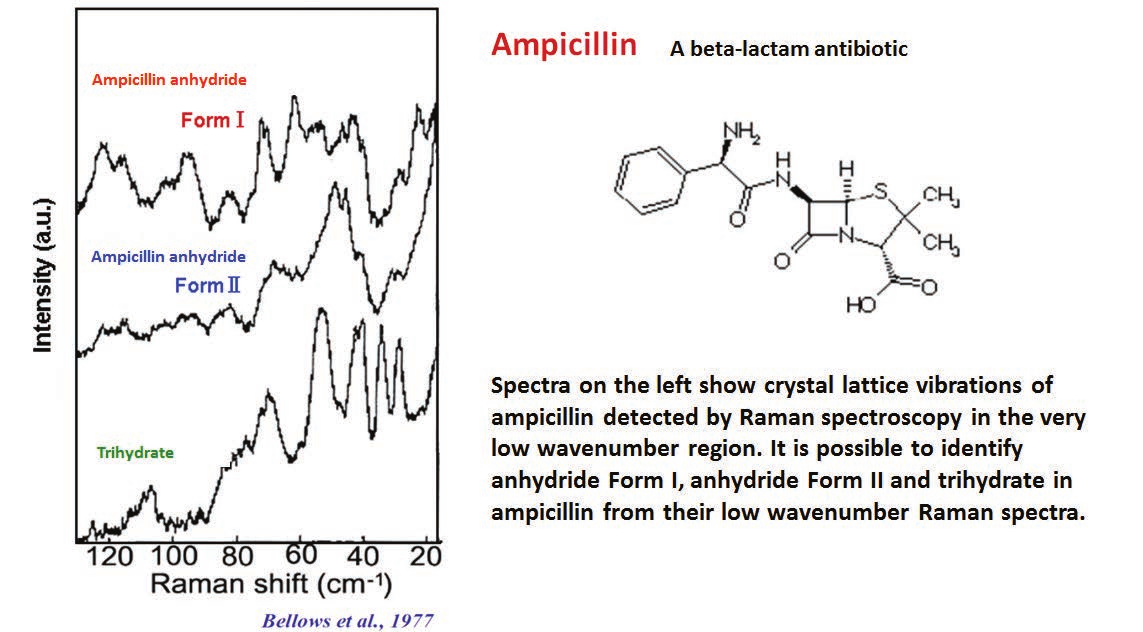
Research papers including low wavenumber measurement- Ampicillin which has several polymorphs-
Measurement Indomethacin Polymorphs using the NRS-7200 Low Wavenumber Measurement Unit: Patent of Crystal Polymorphs
Featured Products:

Analysis of Crystal Polymorphs for Pharmaceutical Development using Raman Spectroscopy
Introduction
Raman Analysis of Crystal Polymorphs
A crystal polymorph can be found where compounds with the same chemical formula can be crystallized into different structures. The crystal structure depends on the conditions (such as temperature and pressure) applied during the crystal formation process. The resulting crystal structures are conveniently classified as Form I, II, III or Ta and Tb .
In medicine, the solubility, stability and bio-availability will depend on the crystal polymorph; compounds with different crystal structures may even be recognized as different compounds. Therefore, research into crystal polymorphs is widely used in areas such as basic studies, structure/function correlation of compounds and industrial applications such as patent applications.
- Impurity Analysis (Identification of micro impurities – sizes less than 1 μm)
- Evaluation of Synthetized Compounds (Structural analysis in combination with IR)
- Mapping (Evaluation of tablets for DDS research)
- PAT (Real-time control in pharma production process)
The use of Raman as an alternative technique for the evaluation of crystal polymorphs (compared with XRD and DSC)

In the pharmaceutical industry, the study of crystal formation techniques is very important for the control of crystal structure and the manufacture of high-quality pharmaceuticals.

Methods for Evaluation of Crystal Polymorph
Three analytical techniques are used in the evaluation of crystal polymorph
| Instrument | Principle | Advantage | Disadvantage |
|---|---|---|---|
| XRD | Evaluation of crystal structure by X-ray diffraction. | Accurate distance between atoms in crystals. XRD is widely used for crystal structure analysis. | Amorphous structure cannot be evaluated by XRD. |
| DSC | Stability and melting point of crystals are evaluated by endothermic/exothermic reaction of the crystal when heating/cooling the sample | Properties of the crystal can be observed. | Crystal structure cannot be determined by DSC. |
| Raman | Chemical structure is evaluated by detecting scattering light at low wavenumbers derived from lattice vibration, by laser irradiation of the sample. | Both crystal and amorphous structures can be evaluated. Vibrational information of molecules can also be obtained from high wavenumber spectra. High spatial resolution and micro measurement can be done. Sample preparation is not required. | It is difficult for Raman to evaluate the absolute configuration of a crystal. |
Raman Spectroscopy is one of the hottest analytical techniques for the study of crystal polymorphs
Features of Raman Spectroscopy for Evaluating Crystal Polymorphs (vs. XRD)

The above spectra show results for both crystalline and amorphous structures of Indometacin using XRD and Raman spectroscopy. Generally it is difficult to measure samples with less reflection (less diffraction spot) such as amorphous and/or minute crystals using X-ray crystal analysis. Since the actual compund formlation includes amorphous and minute crystals in the mixture, Raman spectroscopy is more effective as shown in the right figure. Presently X-Ray crystal analysis is used for the basic study of crystal structure for patent registration, however due to the above reasons, Raman is expected to become a more widely used technique in the pharmaceutical industries for patent registration.
Features of Raman Spectroscopy in Crystal Polymorph Evaluation (vs. DSC)

It is known that Acetylsalicylic acid can exists in crystalline Forms I and II. XRD can be used for crystal structure analysis, but thermal stability cannot be evaluated and useful spectra cannot be obtained for amorphous structures at temperatures higher than the melting point. Conversely, DSC can be used to evaluate the thermal stability of a crystal, but structural information cannot be obtained.
Raman spectra of Acetylsalicylic acid of different particle size

Commercial Acetylsalicylic acid with several different particle sizes were selected and measured using Raman. The results show a change in peak ratio observed in the higher wavenumber region, this is due to the differences in the crystal axis. In addition, differences in the Raman spectra were observed in the region below 200 cm-1 due to differences in particle size and measured position. These results indicates that the commercial medicine is in a mixed crystal state and it is therefore difficult to analyze using DSC due to the different melting points of the crystal forms.
NRS-5000 system with heating stage

By mounting a temperature control system in the NRS-5000 series (or NRS-4100), it is possible to monitor in-situ the structural changes in samples.

Commercial Acetylsalicylic acid with several different particle sizes were selected and measured using Raman. The results show a change in peak ratio observed in the higher wavenumber region, this is due to the differences in the crystal axis. In addition, differences in the Raman spectra were observed in the region below 200 cm-1 due to differences in particle size and measured position. These results indicates that the commercial medicine is in a mixed crystal state and it is therefore difficult to analyze using DSC due to the different melting points of the crystal forms.

By mounting temperature control system on NRS-5000 series, it is possible to monitor in-situ the structural changes in samples.
Real-time Monitoring of Trehalose using a Heating Stage (1)

In-situ monitoring of Trehalose 2H2O (which has high water retention and is used for foods and medicines) at 80 deg. C – spectra measured at one minute intervals. The results shows time-dependent changes in the spectra.
Real-time Monitoring of Trehalose using a Heating Stage (2)

The half bandwidth and the peak shift of two peaks which demonstrate the hydration feature in the previous page were analyzed. The results indicate that the changing process of the peak shift and half bandwidth was observed in three steps and by analyzing peaks in the region 1000-700 cm-1. It was confirmed that the crystal structure of Trehalose changes from a pre-stable structure (crystal or Amorphous) to a stable structure. The combination of Raman fitted with a temperature control system enables the analysis of kinetic structural changes with sample melting.
Features of the NRS-5200 in the evaluation of crystal polymorphism
The above figure shows IR and Raman spectra of L-cystine. Raman spectroscopy enables measurement in the low wavenumber region below 400 cm -1 ; in addition, the NRS-5200 can provide information for the crystal lattice vibrations in the very low wavenumber region down to 10 cm -1 . Since Raman scattering from aqueous solutions or glass is weak, sample pretreatment is not necessary and samples in glass or aqueous samples can be measured easily and non-destructively. One of the features of the NRS-5000 is that crystal polymorphism can be evaluated quantitatively and qualitatively at a high spatial resolution down to ~1 μm.
Low Wavenumber Measurements using a Notch Filter

NRS-5000 series allows not only measurement of the usual inorganic and organic samples, but also measurement in the low wavenumber range using the most suitable optical arrangement. It is possible for the user to easily adjust the optimal angle of the notch filter for low wavenumber measurement as required for each sample. In addition, the NRS-7200 allows very low wavenumber measurement down to 5 cm -1 using the low wavenumber measurement unit.
| NRS-5100/7100 | : down to 50 cm-1 |
| NRS-5200 with low wavenumber measurement unit | : down to 10 cm-1 |
| NRS-7200 with low wavenumber measurement unit | : down to 5 cm-1 |
Low Wavenumber Measurement of Bismuth Oxide by Adjusting the Notch Filter Angle

Since peaks of minerals or lattice vibration derived from crystals are detected in the low wavenumber region, Raman measurement in the low wavenumber region is very important. Rejection of Rayleigh scattering is the key point to detect peaks in the low wavenumber region, so careful optimization is necessary to adjust the angle of the notch filter depending on the sample requirements.
Low Wavenumber Measurement using a Notch Filter: Titanium Oxide with Crystal Polymorphs

NRS-5000 series allows not only measurement of the usual inorganic and organic samples, but also measurement in the low wavenumber range using the most suitable optical arrangement. It is possible for the user to easily adjust the optimal angle of the notch filter for low wavenumber measurement as required for each sample. In addition the NRS-7200 allows very low wavenumber measurement down to 5 cm -1 using the low wavenumber measurement unit.
Measurement of Trehalose using the Low Wavenumber Measurement option on the NRS-7200

Sometimes important peaks are obscured by the notch filter when used with a single monochromator, however, the low wavenumber measurement unit fitted to the NRS-7200 enables clear measurements in the low wavenumber region.


Acetylsalicylic acid was measured with the NRS-7200. The upper spectrum was obtained using the NRS-7200 fitted with a low wavenumber measurement unit, the lower spectrum, without using the option. Using the low wavenumber measurement unit, peaks for the lattice vibrations in the analgesic compound can be clearly observed and important information for crystal polymorph identification can be obtained.
Measurement of Carbamazepine Polymorphs using the NRS-7200 Low Wavenumber Measurement Unit

Since Raman spectroscopy can easily detect peaks in the wavenumber region below 100 cm -1 , it is possible to identify the differences between Forms I and II of carbamazepine whose crystal structures are quite similar. However, the low wavenumber measurement unit is required to characterize the Form III polymorph.
Measurement of Acetaminophen (Paracetamol) using the NRS-7200 Low Wavenumber Measurement Unit

Commercially available Acetaminophen was measured using the NRS-7200. It is known that there are three crystal polymorphs of Paracetamol – Form I, II and III. The above spectra shows the Form I polymorph.
Measurement Indomethacin Polymorphs using the NRS-7200 Low Wavenumber Measurement Unit: Patent of Crystal Polymorphs

The above spectra were obtained by measuring commercially available Indomethacin using the NRS-7200 with and without the low wavenumber measurement unit. It is known that Indomethacin exists as three different crystal polymorphs: alpha (acicular crystal), beta and gamma (plate crystal). Gamma is the most stable structure followed by the alpha structure. Recently, alpha has been selectively manufactured (and patented) to be used for external medicine for enhanced skin absorption and stability. The method for effective manufacturing of a specified crystal polymorph is extremely important.
Research papers including low wavenumber measurement- Ampicillin which has several polymorphs-

Measurement Indomethacin Polymorphs using the NRS-7200 Low Wavenumber Measurement Unit: Patent of Crystal Polymorphs


 Download This Application
![IR and Raman spectra(L-cystine[-SCH2CH(NH2)CO2H]2)](https://jascoinc.com/wp-content/uploads/2014/07/Crystal-Polymorph10.png)
