Analysis of Nylon 6 by Semi-Micro Scale GPC
October 9, 2024
 Download This Application
Introduction
For the room temperature analysis of Nylon (a polyamide synthetic fiber), sample preparation is made by dissolving samples in hexafluoroisopropanol (HFIP). However, a recent cost increase in HFIP has made this analysis more expensive and HFIP is considered environmentally unfriendly. The use of semi-micro separations has a significant advantage for this type of application by reducing the consumption of mobile phase.
To reduce analysis time and solvent consumption, smaller column sizes for rapid analysis are now available for use with GPC analysis.
In this report, the measurement of Nylon 6 films and fibers was performed using the LC-4000 Series RHPLC system with RI-4035 refractive index detector designed for use with semi-micro GPC columns offering high performance analysis. The solvent used is approximately 8 mL per analysis cycle and represents a 75% solvent saving compared with conventional analysis. The average molecular weight was calculated using ChromNAV-GPC, and a molecular weight calibration curve was constructed using a polymethylmethacrylate (PMMA) standard.
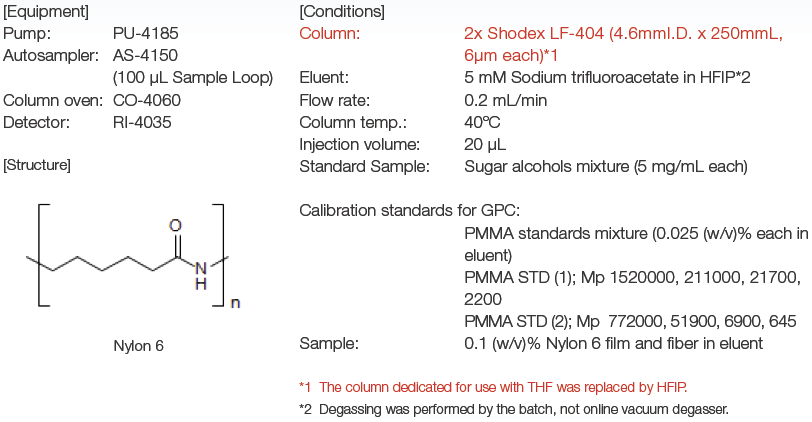
Experimental
Keywords
310013GRE
Results
Fig.1 Chromatograms of PMMA standard.
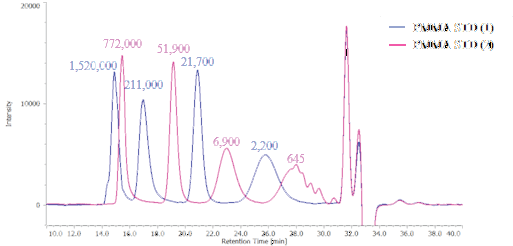
Fig. 2 shows the molecular weight calibration curve using PMMA standard. Fig. 3 displays the chromatogram of Nylon 6 film and molecular weight calibration curve, and its molecular weight distribution curve is in Fig. 4. Fig. 5 is the chromatogram of Nylon 6 fiber and molecular weight calibration curve, and its molecular weight distribution curve is in Fig. 6. Table 1 shows the result of each average molecular weight calculation converted to PMMA.
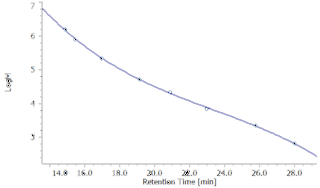
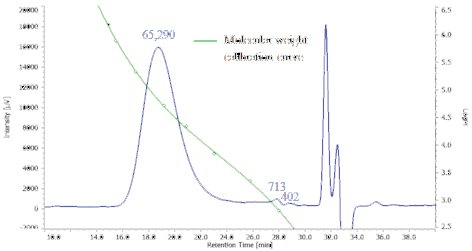
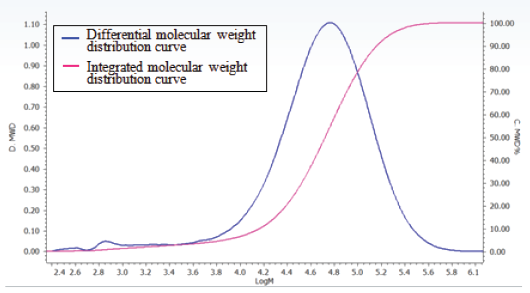
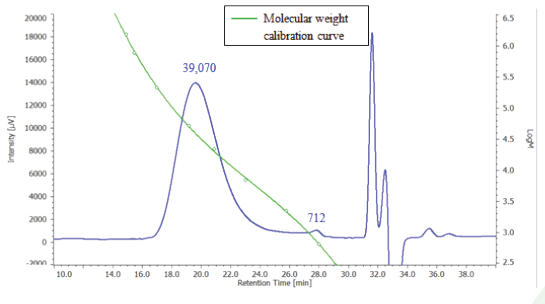
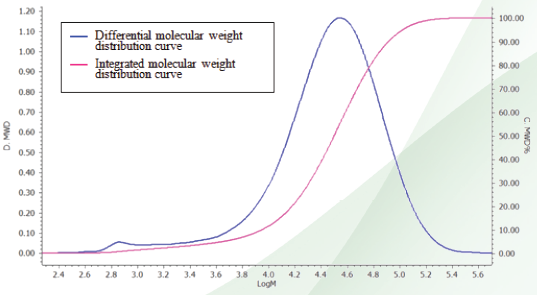
Table 1 Average molecular weight calculation of Nylon 6 film and fiber converted by PMMA
| Mn | Mw | Mz | Mv | Mw/Mn | Mz/ Mw | |
|---|---|---|---|---|---|---|
| Film | 16570 | 70258 | 130381 | 70258 | 4.24 | 1.86 |
| Fiber | 12854 | 40210 | 69148 | 40210 | 3.13 | 1.72 |
Featured Products:

Analysis of Nylon 6 by Semi-Micro Scale GPC
Introduction
For the room temperature analysis of Nylon (a polyamide synthetic fiber), sample preparation is made by dissolving samples in hexafluoroisopropanol (HFIP). However, a recent cost increase in HFIP has made this analysis more expensive and HFIP is considered environmentally unfriendly. The use of semi-micro separations has a significant advantage for this type of application by reducing the consumption of mobile phase.
To reduce analysis time and solvent consumption, smaller column sizes for rapid analysis are now available for use with GPC analysis.
In this report, the measurement of Nylon 6 films and fibers was performed using the LC-4000 Series RHPLC system with RI-4035 refractive index detector designed for use with semi-micro GPC columns offering high performance analysis. The solvent used is approximately 8 mL per analysis cycle and represents a 75% solvent saving compared with conventional analysis. The average molecular weight was calculated using ChromNAV-GPC, and a molecular weight calibration curve was constructed using a polymethylmethacrylate (PMMA) standard.
Experimental
Results
Fig.1 Chromatograms of PMMA standard.
Fig. 2 shows the molecular weight calibration curve using PMMA standard. Fig. 3 displays the chromatogram of Nylon 6 film and molecular weight calibration curve, and its molecular weight distribution curve is in Fig. 4. Fig. 5 is the chromatogram of Nylon 6 fiber and molecular weight calibration curve, and its molecular weight distribution curve is in Fig. 6. Table 1 shows the result of each average molecular weight calculation converted to PMMA.
Table 1 Average molecular weight calculation of Nylon 6 film and fiber converted by PMMA
| Mn | Mw | Mz | Mv | Mw/Mn | Mz/ Mw | |
|---|---|---|---|---|---|---|
| Film | 16570 | 70258 | 130381 | 70258 | 4.24 | 1.86 |
| Fiber | 12854 | 40210 | 69148 | 40210 | 3.13 | 1.72 |
Keywords
310013GRE