Combined analysis of plastic particles by Infrared and Raman microscopy
January 5, 2024
 Download This Application
Introduction
Infrared microscopy (IR) and Raman microscopy are excellent methods for the analysis of molecular structure from molecular vibrations, each of these analytical method has its own distinct merits. On the one hand, there is a large database of IR spectra for organic substances, a major attraction to users when identifying unknown foreign materials. IR is also useful for the analysis of proteins that are more challenging by Raman spectroscopy. On the other hand, Raman spectroscopy is well suited to the analysis of organics, inorganic and carbon-based materials, which can be more arduous by IR.
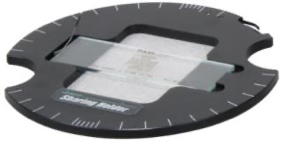
By combining both techniques it is possible to obtain much more detailed information than from either analysis by itself. The accuracy of this comparative analysis has been dramatically improved by the newly developed IQ frame*1), an accessory in which IR and Raman measurement can be performed at exactly the same sample position (Fig. 1). To demonstrate this, in this application note, the component distribution of a sample sprayed with plastic particles was sequentially analyzed using both IR and Raman micro-spectroscopy.
Experimental
1: IR microscopy
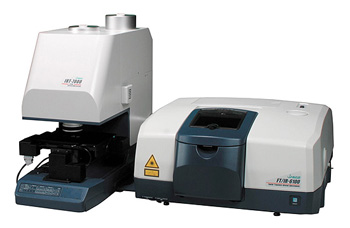
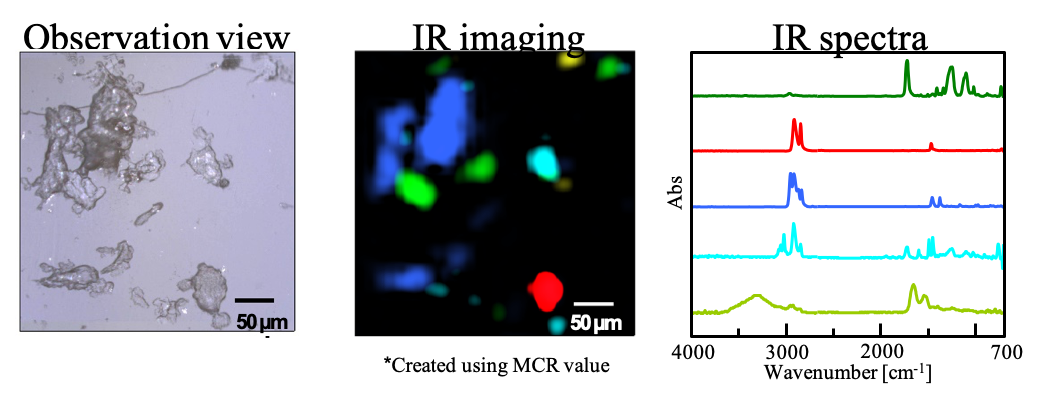
As a result of analyzing the component distribution of plastic particles using an FT/IR-7200 high-speed imaging linear-array IR microscope (Fig. 2), protein was found in addition to four plastics: polyethylene terephthalate (PET), polyethylene (PE), polypropylene (PP), and polystyrene (PS ) (Fig. 3).
2: Raman microscopy
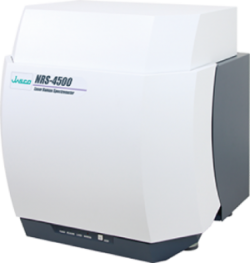
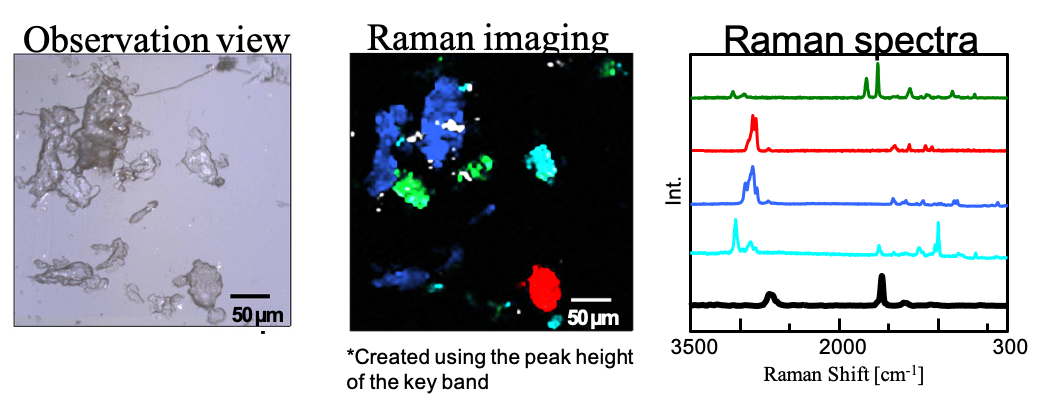
Imaging measurement was performed at the same position as by IR in (Fig. 3) with a high-speed imaging Raman microscope NRS-4500QRI using EMCCD (Fig. 4). IQ Frame was used to transfer the measurement positions between the Raman and IR microscope stages. The component distribution of the plastic particles was re-analyzed and carbon was found in addition to the four plastics previously identified by IR: polyethylene terephthalate (PET), polyethylene (PE), polypropylene (PP), and polystyrene (PS ) (Fig. 5).
In (Fig. 3), protein was detected in addition to the four plastics, whereas in (Fig. 5), carbon was detected without protein detection. These results are obtained because Raman spectroscopy has low detection sensitivity for protein, but it is good for carbon analysis.
3: Overlay of the imaging results of IR and Raman analysis
As a result of the sample imaging shown in (Fig. 3) and (Fig. 5), only five components could be detected in the plastic particle sample by either IR or Raman spectroscopy separately. However, the results of combined analysis using IQ Frame indicated that six different components could be detected and imaged.
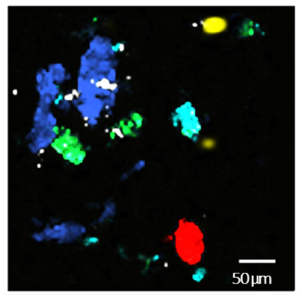
In order to visualize the complete analytical information, both sets of imaging data were overlaid (Fig. 6), this showed the protein detected by IR analysis together with the five other components, polyethylene terephthalate (PET), polyethylene (PE), polypropylene (PP), polystyrene (PS) and carbon detected by Raman analysis. These results demonstrate that using the strong points of both IR and Raman analysis can be combined to be more useful than a single analytical technique alone.
Reference
*1 100-AN-0016
| System Configuration: IR Microscopy System | |||
| Model | Description | P/N | |
| Main Unit | FT/IR-6600 | FT/IR Spectrometer | 7085-J002A*2 |
| Attachment | IRT-7200 | Linear Array Infrared Microscope | 7081-J064A*3 |
| Options | SH02-IR | iQ Frame for IR | 7071-J136A*4 |
*2 FT/IR-4600/4700 and FT/IR-6700/6800 can also be used.
*3 IRT-5200 is also available. Please note that IPS-5000 XYZ auto stage is required for this measurement.
*4 SH02-IR+ is also available if the customer already has SH02-RM.
| System Configuration: Raman Microscopy System | |||
| Model | Description | P/N | |
| Main Unit | NRS-4500-532QRI | Raman Spectrometer with EMCCD | 7118-J061A*5 |
| Options | 532nm Laser power upgrade (100mW) (Factory Option) | 6882-J207A*6 | |
| SH02-IR | iQ Frame for IR | 7071-J137A*7 | |
*5 NRS-5500/7500 can also be used.
*6 Using the standard laser (20 mW), the result in this note is obtained.
*7 SH02-RM+ is also available if the customer already has SH02-IR.
| Measurement Conditions: IR Microscopic System | |
| Mode | Transmission mode (16x Cassegrain objective) |
| Resolution | 8 cm-1 |
| Accumulation | x1 |
| Measurement Area | 400 µm x 400 µm (12.5 μm x 12.5 µm/pixel) |
| Measurement Points | 32 x 32 points (1024 points, measurement time: approx. 10 seconds) |
| Measurement Conditions: Raman Microscopic System | #columnspan# |
| Objective Lens | 20x |
| Exposure Time | 0.5 secs |
| Accumulation | x1 |
| Measurement Area | 348 µm x 368 µm (4 µm x 4 µm interval) |
| Measurement Points | 88 points x 93 points (8184 points, measurement time: approx. 70 min.) |
In this note, only the area used for analysis is displayed from the measured area.
Keywords
100-AN-0028, Raman microscopy, FTIR microscopy, IQ Frame, QRi, mapping, microplastics, protein

Combined analysis of plastic particles by Infrared and Raman microscopy
Introduction
Infrared microscopy (IR) and Raman microscopy are excellent methods for the analysis of molecular structure from molecular vibrations, each of these analytical method has its own distinct merits. On the one hand, there is a large database of IR spectra for organic substances, a major attraction to users when identifying unknown foreign materials. IR is also useful for the analysis of proteins that are more challenging by Raman spectroscopy. On the other hand, Raman spectroscopy is well suited to the analysis of organics, inorganic and carbon-based materials, which can be more arduous by IR.
By combining both techniques it is possible to obtain much more detailed information than from either analysis by itself. The accuracy of this comparative analysis has been dramatically improved by the newly developed IQ frame*1), an accessory in which IR and Raman measurement can be performed at exactly the same sample position (Fig. 1). To demonstrate this, in this application note, the component distribution of a sample sprayed with plastic particles was sequentially analyzed using both IR and Raman micro-spectroscopy.
Experimental
1: IR microscopy
As a result of analyzing the component distribution of plastic particles using an FT/IR-7200 high-speed imaging linear-array IR microscope (Fig. 2), protein was found in addition to four plastics: polyethylene terephthalate (PET), polyethylene (PE), polypropylene (PP), and polystyrene (PS ) (Fig. 3).
2: Raman microscopy
Imaging measurement was performed at the same position as by IR in (Fig. 3) with a high-speed imaging Raman microscope NRS-4500QRI using EMCCD (Fig. 4). IQ Frame was used to transfer the measurement positions between the Raman and IR microscope stages. The component distribution of the plastic particles was re-analyzed and carbon was found in addition to the four plastics previously identified by IR: polyethylene terephthalate (PET), polyethylene (PE), polypropylene (PP), and polystyrene (PS ) (Fig. 5).
In (Fig. 3), protein was detected in addition to the four plastics, whereas in (Fig. 5), carbon was detected without protein detection. These results are obtained because Raman spectroscopy has low detection sensitivity for protein, but it is good for carbon analysis.
3: Overlay of the imaging results of IR and Raman analysis
As a result of the sample imaging shown in (Fig. 3) and (Fig. 5), only five components could be detected in the plastic particle sample by either IR or Raman spectroscopy separately. However, the results of combined analysis using IQ Frame indicated that six different components could be detected and imaged.
In order to visualize the complete analytical information, both sets of imaging data were overlaid (Fig. 6), this showed the protein detected by IR analysis together with the five other components, polyethylene terephthalate (PET), polyethylene (PE), polypropylene (PP), polystyrene (PS) and carbon detected by Raman analysis. These results demonstrate that using the strong points of both IR and Raman analysis can be combined to be more useful than a single analytical technique alone.
Reference
*1 100-AN-0016
| System Configuration: IR Microscopy System | |||
| Model | Description | P/N | |
| Main Unit | FT/IR-6600 | FT/IR Spectrometer | 7085-J002A*2 |
| Attachment | IRT-7200 | Linear Array Infrared Microscope | 7081-J064A*3 |
| Options | SH02-IR | iQ Frame for IR | 7071-J136A*4 |
*2 FT/IR-4600/4700 and FT/IR-6700/6800 can also be used.
*3 IRT-5200 is also available. Please note that IPS-5000 XYZ auto stage is required for this measurement.
*4 SH02-IR+ is also available if the customer already has SH02-RM.
| System Configuration: Raman Microscopy System | |||
| Model | Description | P/N | |
| Main Unit | NRS-4500-532QRI | Raman Spectrometer with EMCCD | 7118-J061A*5 |
| Options | 532nm Laser power upgrade (100mW) (Factory Option) | 6882-J207A*6 | |
| SH02-IR | iQ Frame for IR | 7071-J137A*7 | |
*5 NRS-5500/7500 can also be used.
*6 Using the standard laser (20 mW), the result in this note is obtained.
*7 SH02-RM+ is also available if the customer already has SH02-IR.
| Measurement Conditions: IR Microscopic System | |
| Mode | Transmission mode (16x Cassegrain objective) |
| Resolution | 8 cm-1 |
| Accumulation | x1 |
| Measurement Area | 400 µm x 400 µm (12.5 μm x 12.5 µm/pixel) |
| Measurement Points | 32 x 32 points (1024 points, measurement time: approx. 10 seconds) |
| Measurement Conditions: Raman Microscopic System | #columnspan# |
| Objective Lens | 20x |
| Exposure Time | 0.5 secs |
| Accumulation | x1 |
| Measurement Area | 348 µm x 368 µm (4 µm x 4 µm interval) |
| Measurement Points | 88 points x 93 points (8184 points, measurement time: approx. 70 min.) |
In this note, only the area used for analysis is displayed from the measured area.
Keywords
100-AN-0028, Raman microscopy, FTIR microscopy, IQ Frame, QRi, mapping, microplastics, protein