Confocal Raman Imaging – Using Spectroscopy for Materials Analysis and Chemical Distribution
August 24, 2022
 Download This Application
Introduction
Confocal Raman Imaging has increasingly gathered momentum as a method of interest for a wide range of applications 1, including those involved in materials analysis and bio-analysis . The relative simplicity and the reliability of modern Raman instrumentation, higher spatial resolution and a gradual reduction in purchase price have continued to attract new and varied users to Raman spectroscopy.
Raman imaging spectroscopy offers component identification similar to IR spectroscopy but without the extensive sample preparation often required for IR analysis. Confocal Raman Imaging can be used to investigate subsurface structure of laser transparent materials by measuring spectral matrices in 3D. The use of Raman for spectral imaging has some restrictions, such as the length of time required to obtain Raman imaging data for large sample areas, however with fast mapping stages and optics and high sensitivity CCD detectors, the overall time required for mapping is significantly reduced in the newer ranges of instruments.
IR imaging still enjoys an advantage due to lower instrument costs and an earlier development of technology. The major obstacles to infrared imaging that remain, are the fundamental restrictions in spatial resolution for IR spectroscopy (approximately 2-10 µm) and the requirement to properly prepare samples to obtain optimal measurable IR spectra. Ideally, the combining of both IR and Raman imaging techniques for sample analysis, would bring the opportunity to exploit their respective benefits.
The Need for Speed: Increasing Raman Imaging Efficiency
Various methods have been proposed to increase the speed of Raman imaging systems while still maintaining the quality of data , confocal microscopy and spatial resolution that can be obtained for ‘standard’ sample spectra. While no single technology appears to enjoy a superior advantage for increasing the speed of Raman imaging, there are attractive features for each method2, 3 (with corresponding buzzwords describing the functions).
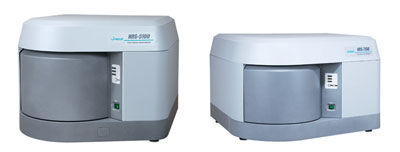
The NRS-5000/7000 series of Confocal Imaging Raman microscopes employs QRi and SPRIntS for for very fast imaging measurement of 3D sample. Verti-Scan sample illumination provides optimal, reproducible control of the laser spot on the sample, allowing a measurement step size of less than 50 nm while maintaining the confocal functionality of the instrument. Verti-Scan offers high resolution, high speed imaging for ‘standard surface’ analysis of samples, and 3D confocal imaging of laser transparent samples in the XYZ dimensions. When combined with the Interval Measurement software, dynamic imaging experiments can also be made, with data measured as intensity vs. time.
This application note will outline the rapid Raman imaging of samples using a sample excitation technology that improves spatial resolution while maintaining the confocal functionality of the Raman technique. This also enables the mapping of a sample to provide a three-dimensional image of component ‘inclusions’ within a sample matrix. Data will be presented from several samples demonstrating the increased speed and efficiency of Confocal Raman Imaging. We will also discuss the benefits and advantages of this mapping method and outline the applicability of this instrument system to a selection of samples.
To increase the speed and efficiency of Confocal Raman Imaging applications the following may be used:
- Use ‘macro’ illumination of the sample with ‘micro’ Raman signal measurement
- Obtain a ‘bare minimum’ signal for the strongest peaks of the sample
- Reduce the requirements for spectral and spatial resolution
- Use a fast response CCD detector with electron-multiplying to enhance Raman signals
- Reduce the need to move the sample stage for each measurement point
Experimental
‘VertiScan’ Sample Excitation
- The laser always irradiates the sample vertically to obtain a circular image of the laser spot for Raman imaging without distortion
- Accurate image information also obtained when using 3D imaging
- A wide area sample measurement using only laser scanning (50 µm x 50 µm using a 100x objective lens)

SPRIntS High Speed Imaging
The SPRIntS and VertiScan functions provide an imaging measurement with minimum 30 nm spatial resolution, without the use of an auto-stage.

Depth imaging data from a sample can be measured using confocal imaging and a 3D image is created from the Raman intensity data. Multilayer sample analysis is also possible using this feature.

A polymer laminate of multiple layers comprised of 3 primary polymer components – data collected using a ‘cross-section’ of the laminate

Polymer Laminate – Cross Section Spectral images Based on Integrated Peak Height

Polymer Laminate – Image Overlay of Individual Laminate Spectral images

Polymer Laminate – 3D Image Representations (1639 cm-1)

Polymer Laminate – 3D Composite Image

Cyanoacrylate Adhesive Reaction Kinetics
- A cyanoacrylate adhesive was analyzed during the curing process to examine the changes in spectra.
- Raman spectra were collected of a single drop of adhesive as it dried, then analyzed to determine what spectral changes occurred.
- The intensity changes for a peak in the C-H stretching region were analyzed to obtain the rate constants for the reaction process.
- Spectra were collected for a single-point on the glue surface; then a mapping of the glue surface was attempted to obtain data for the reaction time course.
CyanoAcrylate Adhesive – Raman Spectra at Different Reaction Times

Cyanoacrylate Adhesive – Single-point, 3D Spectra, C-H Stretching Region

CyanoAcrylate Adhesive – Single-Point Kinetics Analysis

Time constant 378.689 [1/sec]
Rate constant 0.00264069 [sec]
Half-life 262.487 [sec]
CyanoAcrylate Adhesive – 3D Mapping Data

CyanoAcrylate Adhesive – Mapping Data Analysis Figures

CyanoAcrylate Adhesive – Mapping Data Kinetics Analysis
Time constant 419.303 [1/sec]
Rate constant 0.00238491 [sec]
Half-life 290.639 [sec]
Time constant 419.303 [1/sec]
Rate constant 0.00238491 [sec]
Half-life 290.639 [sec]
Keywords
confocal raman imaging, confocal microscopy, Raman spectroscopy, laminate analysis, cyanoacrylate, polymers.
Conclusion
- The NRS-5000/7000 series of Confocal Raman Imaging Microscopes include the SPRIntS and VertiScan features for rapid imaging , even when using a manual stage, without:
- Confocal distortion
- Loss of spectral or spatial resolution
- Losses in sensitivity
- 3D confocal imaging can be obtained using VertiScan , providing XYZ imaging without spectral or optical distortion.
- Rapid data collection was used to demonstrate 3D spectral mapping of a sample surface versus time, to obtain reaction rate data of a cyanoacrylate adhesive curing process.
References
Richard A. Larsena, Yoshiko Kubob, Ken-ichi Akaob, Yusei Ohkubob, Masaki Yumotob, and Toshiyuki Nagoshib
a JASCO, Inc., 28600 Mary’s Court, Easton, MD 21601
b JASCO Corporation, 2967-5 Ishikawa-cho, Hachioji-shi, Tokyo, Japan 192-8537
Featured Products:

Confocal Raman Imaging – Using Spectroscopy for Materials Analysis and Chemical Distribution
Introduction
Confocal Raman Imaging has increasingly gathered momentum as a method of interest for a wide range of applications 1, including those involved in materials analysis and bio-analysis . The relative simplicity and the reliability of modern Raman instrumentation, higher spatial resolution and a gradual reduction in purchase price have continued to attract new and varied users to Raman spectroscopy.
Raman imaging spectroscopy offers component identification similar to IR spectroscopy but without the extensive sample preparation often required for IR analysis. Confocal Raman Imaging can be used to investigate subsurface structure of laser transparent materials by measuring spectral matrices in 3D. The use of Raman for spectral imaging has some restrictions, such as the length of time required to obtain Raman imaging data for large sample areas, however with fast mapping stages and optics and high sensitivity CCD detectors, the overall time required for mapping is significantly reduced in the newer ranges of instruments.
IR imaging still enjoys an advantage due to lower instrument costs and an earlier development of technology. The major obstacles to infrared imaging that remain, are the fundamental restrictions in spatial resolution for IR spectroscopy (approximately 2-10 µm) and the requirement to properly prepare samples to obtain optimal measurable IR spectra. Ideally, the combining of both IR and Raman imaging techniques for sample analysis, would bring the opportunity to exploit their respective benefits.
The Need for Speed: Increasing Raman Imaging Efficiency
Various methods have been proposed to increase the speed of Raman imaging systems while still maintaining the quality of data , confocal microscopy and spatial resolution that can be obtained for ‘standard’ sample spectra. While no single technology appears to enjoy a superior advantage for increasing the speed of Raman imaging, there are attractive features for each method2, 3 (with corresponding buzzwords describing the functions).
The NRS-5000/7000 series of Confocal Imaging Raman microscopes employs QRi and SPRIntS for for very fast imaging measurement of 3D sample. Verti-Scan sample illumination provides optimal, reproducible control of the laser spot on the sample, allowing a measurement step size of less than 50 nm while maintaining the confocal functionality of the instrument. Verti-Scan offers high resolution, high speed imaging for ‘standard surface’ analysis of samples, and 3D confocal imaging of laser transparent samples in the XYZ dimensions. When combined with the Interval Measurement software, dynamic imaging experiments can also be made, with data measured as intensity vs. time.
This application note will outline the rapid Raman imaging of samples using a sample excitation technology that improves spatial resolution while maintaining the confocal functionality of the Raman technique. This also enables the mapping of a sample to provide a three-dimensional image of component ‘inclusions’ within a sample matrix. Data will be presented from several samples demonstrating the increased speed and efficiency of Confocal Raman Imaging. We will also discuss the benefits and advantages of this mapping method and outline the applicability of this instrument system to a selection of samples.
To increase the speed and efficiency of Confocal Raman Imaging applications the following may be used:
- Use ‘macro’ illumination of the sample with ‘micro’ Raman signal measurement
- Obtain a ‘bare minimum’ signal for the strongest peaks of the sample
- Reduce the requirements for spectral and spatial resolution
- Use a fast response CCD detector with electron-multiplying to enhance Raman signals
- Reduce the need to move the sample stage for each measurement point
Experimental
‘VertiScan’ Sample Excitation
- The laser always irradiates the sample vertically to obtain a circular image of the laser spot for Raman imaging without distortion
- Accurate image information also obtained when using 3D imaging
- A wide area sample measurement using only laser scanning (50 µm x 50 µm using a 100x objective lens)
SPRIntS High Speed Imaging
The SPRIntS and VertiScan functions provide an imaging measurement with minimum 30 nm spatial resolution, without the use of an auto-stage.
Depth imaging data from a sample can be measured using confocal imaging and a 3D image is created from the Raman intensity data. Multilayer sample analysis is also possible using this feature.
A polymer laminate of multiple layers comprised of 3 primary polymer components – data collected using a ‘cross-section’ of the laminate
Polymer Laminate – Cross Section Spectral images Based on Integrated Peak Height
Polymer Laminate – Image Overlay of Individual Laminate Spectral images
Polymer Laminate – 3D Image Representations (1639 cm-1)
Polymer Laminate – 3D Composite Image
Cyanoacrylate Adhesive Reaction Kinetics
- A cyanoacrylate adhesive was analyzed during the curing process to examine the changes in spectra.
- Raman spectra were collected of a single drop of adhesive as it dried, then analyzed to determine what spectral changes occurred.
- The intensity changes for a peak in the C-H stretching region were analyzed to obtain the rate constants for the reaction process.
- Spectra were collected for a single-point on the glue surface; then a mapping of the glue surface was attempted to obtain data for the reaction time course.
CyanoAcrylate Adhesive – Raman Spectra at Different Reaction Times
Cyanoacrylate Adhesive – Single-point, 3D Spectra, C-H Stretching Region
CyanoAcrylate Adhesive – Single-Point Kinetics Analysis
Time constant 378.689 [1/sec]
Rate constant 0.00264069 [sec]
Half-life 262.487 [sec]
CyanoAcrylate Adhesive – 3D Mapping Data
CyanoAcrylate Adhesive – Mapping Data Analysis Figures
CyanoAcrylate Adhesive – Mapping Data Kinetics Analysis
Time constant 419.303 [1/sec]
Rate constant 0.00238491 [sec]
Half-life 290.639 [sec]
Time constant 419.303 [1/sec]
Rate constant 0.00238491 [sec]
Half-life 290.639 [sec]
Conclusion
- The NRS-5000/7000 series of Confocal Raman Imaging Microscopes include the SPRIntS and VertiScan features for rapid imaging , even when using a manual stage, without:
- Confocal distortion
- Loss of spectral or spatial resolution
- Losses in sensitivity
- 3D confocal imaging can be obtained using VertiScan , providing XYZ imaging without spectral or optical distortion.
- Rapid data collection was used to demonstrate 3D spectral mapping of a sample surface versus time, to obtain reaction rate data of a cyanoacrylate adhesive curing process.
Keywords
confocal raman imaging, confocal microscopy, Raman spectroscopy, laminate analysis, cyanoacrylate, polymers.
References
Richard A. Larsena, Yoshiko Kubob, Ken-ichi Akaob, Yusei Ohkubob, Masaki Yumotob, and Toshiyuki Nagoshib
a JASCO, Inc., 28600 Mary’s Court, Easton, MD 21601
b JASCO Corporation, 2967-5 Ishikawa-cho, Hachioji-shi, Tokyo, Japan 192-8537