Determination of Fluorescence Excitation/Emission Maxima
August 25, 2022
 Download This Application
Introduction
To determine the most favorable parameters for acquisition of fluorescence spectra, a 3D Fluorescence Measurement Program is included in Spectra Manager to provide a simple method for establishing the optimum parameters for further experiments.
One of the challenges in performing fluorescence measurement is determining the optimum excitation and emission wavelengths for an unknown sample. With the large amount of information that can be obtained using fluorescence techniques, it is critical to use instrument conditions that offer the best data. The 3D fluorescence measurement program is used to search for the optimum peak excitation and emission wavelengths for unknown samples. This is done by measuring the emission spectrum of a sample while varying the excitation wavelength or, conversely, measuring the excitation spectrum as the emission wavelength is varied.
Experimental
An FP-6500 Spectrofluorometer with standard 10 mm cuvette holder was used for all analyses. Fluorescence Standard Reference Materials (SRM) were obtained from Starna.
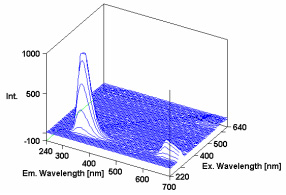
In Figure 1, the 3D spectra of p-terphenyl, a laser dye and a component of sunscreens, has a maximum excitation of 295 nm and emission of approx. 340 nm.
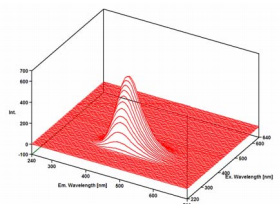
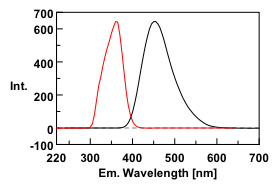
Quinine is a strongly fluorescence compound that is found in tonic water. In dilute acid solution, there are 2 absorption bands centered at 250 nm and 350 nm and a peak fluorescence emission at 450 nm. After measurement of the 3D spectrum of the tonic water sample, the 3D fluorescence analysis program in Spectra Manager was used to perform an emission search to determine the maximum excitation and emission wavelengths. The results were in good agreement with known literature values.
Keywords
p-terphenyl, quinine, spectrofluorometer, emission wavelength, excitation wavelength, FP-6500, FP-8300
Conclusion
Using the 3-D Fluorescence Measurement Program within the Spectra Manager software, it was possible to determine the optimum excitation and emission conditions for various samples.
Featured Products:
-
Uniquely optimized for NIR applications with extended wavelength measurement to 1010 nm.
FP-8650 NIR Spectrofluorometer
-
Sophisticated optical system offering the ultimate in sensitivity, spectral accuracy, and flexibility for the most challenging materials and biological samples.
FP-8550 Spectrofluorometer
-
A powerful combination of performance, sensitivity and flexibility for biological, environmental and materials analysis.
FP-8350 Spectrofluorometer

Determination of Fluorescence Excitation/Emission Maxima
Introduction
To determine the most favorable parameters for acquisition of fluorescence spectra, a 3D Fluorescence Measurement Program is included in Spectra Manager to provide a simple method for establishing the optimum parameters for further experiments.
One of the challenges in performing fluorescence measurement is determining the optimum excitation and emission wavelengths for an unknown sample. With the large amount of information that can be obtained using fluorescence techniques, it is critical to use instrument conditions that offer the best data. The 3D fluorescence measurement program is used to search for the optimum peak excitation and emission wavelengths for unknown samples. This is done by measuring the emission spectrum of a sample while varying the excitation wavelength or, conversely, measuring the excitation spectrum as the emission wavelength is varied.
Experimental
An FP-6500 Spectrofluorometer with standard 10 mm cuvette holder was used for all analyses. Fluorescence Standard Reference Materials (SRM) were obtained from Starna.
In Figure 1, the 3D spectra of p-terphenyl, a laser dye and a component of sunscreens, has a maximum excitation of 295 nm and emission of approx. 340 nm.
Quinine is a strongly fluorescence compound that is found in tonic water. In dilute acid solution, there are 2 absorption bands centered at 250 nm and 350 nm and a peak fluorescence emission at 450 nm. After measurement of the 3D spectrum of the tonic water sample, the 3D fluorescence analysis program in Spectra Manager was used to perform an emission search to determine the maximum excitation and emission wavelengths. The results were in good agreement with known literature values.
Conclusion
Using the 3-D Fluorescence Measurement Program within the Spectra Manager software, it was possible to determine the optimum excitation and emission conditions for various samples.
Keywords
p-terphenyl, quinine, spectrofluorometer, emission wavelength, excitation wavelength, FP-6500, FP-8300