High-Speed Measurement and EEM Interpretation for Olive Oil Analysis
January 5, 2024
 Download This Application
Introduction
Excitation-Emission Matrix (EEM) is used with fluorescence spectroscopy for identification and characterization in mixture analysis. Recently, EEM has started to become an accepted method for determining the type, quality, and geographical origin of food products. To firmly establish EEM as a reliable method for this type of analysis, more references are required, and therefore many more samples should be measured (from hundreds to thousands).
In order to increase sample throughput, a system has been developed for high-speed 3D fluorescence measurement using the FP-8500 Spectrofluorometer coupled with an MV-3500 multi-channel spectral detector.
To demonstrate the ease-of-use of this high-speed measurement system, this application note reports the results for the measurement of a variety of olive oil samples. In addition, this note shows the use of EEM interpretation for characterizing the olive oil samples.
Experimental
Measurement Conditions
| Excitation Bandwidth | 10 nm | Emission Bandwidth | 5 nm |
| Excitation Data Interval | 5 nm | Emission Data Interval | 1 nm |
| Response | 20 sec | Filter | Used |
Solutions of extra virgin (A, B, C, D, E, and F) and pure (G and H) olive oil were diluted in hexane at a 1:350 ratio to obtain an absorbance less than 0.02 AU.
The excitation and emission spectra were obtained and corrected for using calibrated light sources (WI and D2).
Keywords
080-FP-0021, FP-8300, Fluorescence, MV-3500, EEM (Excitation-Emission Matrix), PARAFAC (Parallel Factor Analysis), Materials, Food science
Results
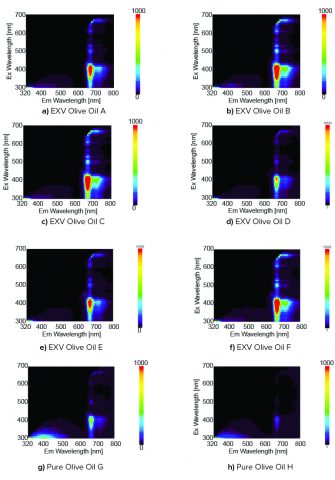
The 3D fluorescence spectra of hexane and the olive oil samples were obtained and corrected for using the calibrated excitation and emission spectra. The hexane spectra were then subtracted from the olive oil sample spectra to remove the hexane Raman peaks. The subtracted sample spectra are shown in Figure 1. The peak locations in Figure 1 and literature1 were used to estimate the components of the samples and are the following: oxidation product (Ex: 300 to 400 nm, Em: 320 to 500 nm), vitamin E (Ex: 300 to 400 nm, Em: 500 to 600 nm), and chlorophyll (Ex: 300 to 700 nm, Em: 650 to 800 nm).
Parallel factor analysis (PARAFAC) was performed on the 3D fluorescence data and the number of component spectra was set to 2. Figure 2 shows the component spectra calculated by PARAFAC. The first component spectrum is chlorophyll and the second is an oxidation product and vitamin E.
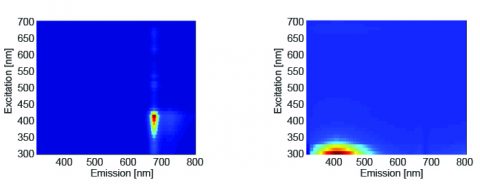
Figure 3 shows the score plot for the first component (chlorophyll) and the second component (an oxidation product and vitamin E). Regarding the distribution in the extra virgin olive oil, the score for the first component is large while the second is small. However, the distribution in the pure olive oil shows the score of first component is small while the second is large. This trend is related to the production process of the olive oil. Extra virgin olive oil is produced by squeezing and filtering the fruit of the olive without any chemical treatment process, and the acidity of the olive oil is less than 0.8%. On the other hand, pure olive oil is a blend of virgin olive oil and refined olive oil, so the acidity of pure olive oil is less than 1%. In addition, the chlorophyll content of pure olive oil is small because it is reduced during the production process for refining the olive oil.
Conclusion
These results demonstrate JASCO’s high-speed fluorescence measurement system and the use of PARAFAC analysis for the interpretation of EEM. PARAFAC was used to extract the component spectra from 3D fluorescence data to estimate the compounds from the component spectra. The score plot calculated by PARAFAC can provide information about the characteristics of a sample and is useful for determining sample type and quality.
References
1) Kongbonga YGM, Ghalila H, Onana MB, Majdi Y, Lakhdar ZB, Mezlini H and Ghalila SS, Food and Nutrition Sciences, 2, 692-699, (2011).
Featured Products:
-
A powerful combination of performance, sensitivity and flexibility for biological, environmental and materials analysis.
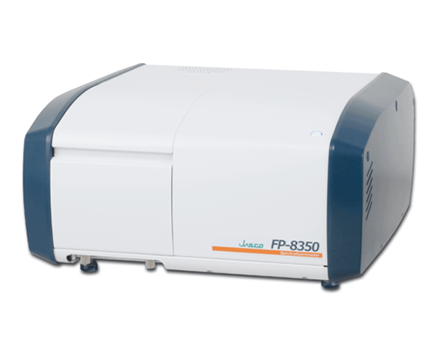
FP-8350 Spectrofluorometer
-
Sophisticated optical system offering the ultimate in sensitivity, spectral accuracy, and flexibility for the most challenging materials and biological samples.
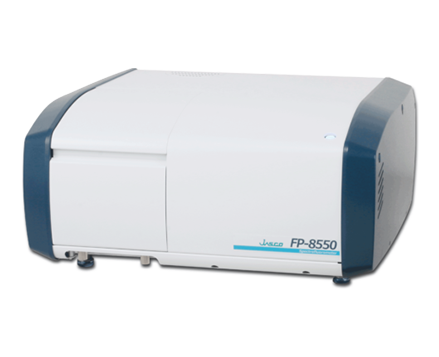
FP-8550 Spectrofluorometer
-
Uniquely optimized for NIR applications with extended wavelength measurement to 1010 nm.
FP-8650 NIR Spectrofluorometer

High-Speed Measurement and EEM Interpretation for Olive Oil Analysis
Introduction
Excitation-Emission Matrix (EEM) is used with fluorescence spectroscopy for identification and characterization in mixture analysis. Recently, EEM has started to become an accepted method for determining the type, quality, and geographical origin of food products. To firmly establish EEM as a reliable method for this type of analysis, more references are required, and therefore many more samples should be measured (from hundreds to thousands).
In order to increase sample throughput, a system has been developed for high-speed 3D fluorescence measurement using the FP-8500 Spectrofluorometer coupled with an MV-3500 multi-channel spectral detector.
To demonstrate the ease-of-use of this high-speed measurement system, this application note reports the results for the measurement of a variety of olive oil samples. In addition, this note shows the use of EEM interpretation for characterizing the olive oil samples.
Experimental
Measurement Conditions
| Excitation Bandwidth | 10 nm | Emission Bandwidth | 5 nm |
| Excitation Data Interval | 5 nm | Emission Data Interval | 1 nm |
| Response | 20 sec | Filter | Used |
Solutions of extra virgin (A, B, C, D, E, and F) and pure (G and H) olive oil were diluted in hexane at a 1:350 ratio to obtain an absorbance less than 0.02 AU.
The excitation and emission spectra were obtained and corrected for using calibrated light sources (WI and D2).
Results
The 3D fluorescence spectra of hexane and the olive oil samples were obtained and corrected for using the calibrated excitation and emission spectra. The hexane spectra were then subtracted from the olive oil sample spectra to remove the hexane Raman peaks. The subtracted sample spectra are shown in Figure 1. The peak locations in Figure 1 and literature1 were used to estimate the components of the samples and are the following: oxidation product (Ex: 300 to 400 nm, Em: 320 to 500 nm), vitamin E (Ex: 300 to 400 nm, Em: 500 to 600 nm), and chlorophyll (Ex: 300 to 700 nm, Em: 650 to 800 nm).
Parallel factor analysis (PARAFAC) was performed on the 3D fluorescence data and the number of component spectra was set to 2. Figure 2 shows the component spectra calculated by PARAFAC. The first component spectrum is chlorophyll and the second is an oxidation product and vitamin E.
Figure 3 shows the score plot for the first component (chlorophyll) and the second component (an oxidation product and vitamin E). Regarding the distribution in the extra virgin olive oil, the score for the first component is large while the second is small. However, the distribution in the pure olive oil shows the score of first component is small while the second is large. This trend is related to the production process of the olive oil. Extra virgin olive oil is produced by squeezing and filtering the fruit of the olive without any chemical treatment process, and the acidity of the olive oil is less than 0.8%. On the other hand, pure olive oil is a blend of virgin olive oil and refined olive oil, so the acidity of pure olive oil is less than 1%. In addition, the chlorophyll content of pure olive oil is small because it is reduced during the production process for refining the olive oil.
Conclusion
These results demonstrate JASCO’s high-speed fluorescence measurement system and the use of PARAFAC analysis for the interpretation of EEM. PARAFAC was used to extract the component spectra from 3D fluorescence data to estimate the compounds from the component spectra. The score plot calculated by PARAFAC can provide information about the characteristics of a sample and is useful for determining sample type and quality.
Keywords
080-FP-0021, FP-8300, Fluorescence, MV-3500, EEM (Excitation-Emission Matrix), PARAFAC (Parallel Factor Analysis), Materials, Food science
References
1) Kongbonga YGM, Ghalila H, Onana MB, Majdi Y, Lakhdar ZB, Mezlini H and Ghalila SS, Food and Nutrition Sciences, 2, 692-699, (2011).