Fluorescence Measurement of Heat-Denatured Lysozyme
August 25, 2022
Introduction
Experiments studying the denaturation of proteins are generally made using circular dichroism. However, proteins contain aromatic amino acids (AAA) will fluoresce when excited with UV light. During heat denaturation of proteins, the secondary structure of the protein will change and the aromatic amino-acid residues will change slightly which can be detected by fluorescence.
Experimental
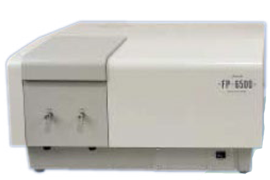
Emission (EM) spectra of lysozyme using an excitation (EX) of 280 nm are measured while controlling the temperature, to examine the relation between temperature and the fluorescence spectrum. The FP-6500 spectrofluorometer with a ETC-272 Peltier thermostatted cell holder are used for the measurements in this experiment, using the instrument parameters outlined below.
Parameters
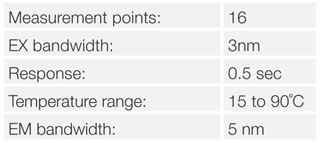
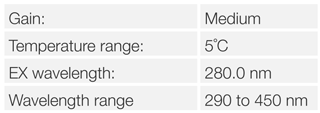
A buffered aqueous solution of 0.1mg/mL of lysozyme was used as the sample, the measurement performed by stirring the sample with a magnetic stirrer to ensure even sample temperatures in the cell. A temperature ramping rate of 1°C/min was controlled by the Peltier cell holder. Spectra were measured 60 seconds after reaching the set temperature.
Results
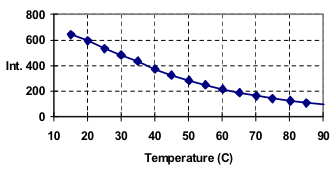
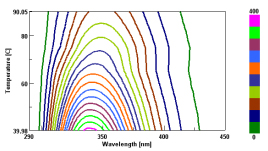
The graph below (Figure 1) shows the change in intensity vs. temperature at 340 nm. Lysozyme is known to denature at a temperature of 70°C; however the graph of fluorescence vs. temperature shows only a decrease in intensity as the temperature increases. By contrast, the EM Spectra from 40 to 90 degrees plotted using a contour view demonstrates a transition of the spectra at 70 degrees (Figure 2).
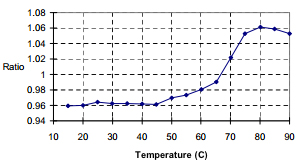
The EM spectra at room temperature have a maxima at 340 nm with a corresponding maxima at 348 nm for 90 degrees. A plot of the intensity ratios for the two wavelengths versus temperature results in a graph that demonstrates a heat-denaturation at 70°C (Figure 3), in agreement with literature values.
Required Products and Software
- FP-8200/8300/8500/8600/8700 Spectrofluorometer
- ETC-814/815 Water-cooled Peltier Thermostatted Cell Holder with Stirrer, or PTC-818 Water-cooled Peltier Thermostatted 4-position Automatic Cell Changer with Stirrer
- FWTS-872 Temperature Interval Scan Measurement program
Featured Products:
-
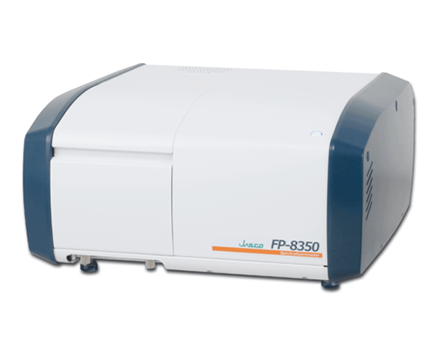
A powerful combination of performance, sensitivity and flexibility for biological, environmental and materials analysis.
FP-8350 Spectrofluorometer
-
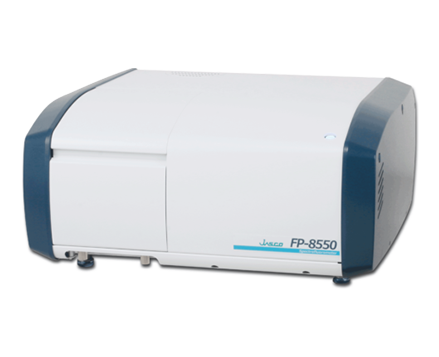
Sophisticated optical system offering the ultimate in sensitivity, spectral accuracy, and flexibility for the most challenging materials and biological samples.
FP-8550 Spectrofluorometer
-
FP-8650 NIR Spectrofluorometer
-
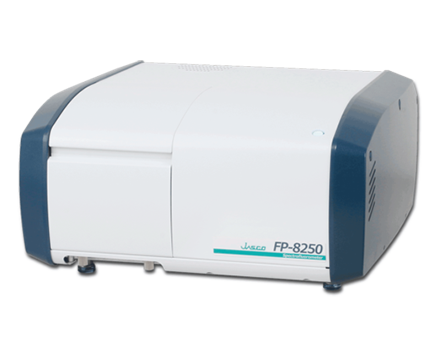
Simple and sensitive system which readily accommodates routine measurements and accessories, such as spectral scanning, quantitation, and temperature control.
FP-8250 Spectrofluorometer

Fluorescence Measurement of Heat-Denatured Lysozyme
Introduction
Experiments studying the denaturation of proteins are generally made using circular dichroism. However, proteins contain aromatic amino acids (AAA) will fluoresce when excited with UV light. During heat denaturation of proteins, the secondary structure of the protein will change and the aromatic amino-acid residues will change slightly which can be detected by fluorescence.

Experimental
Emission (EM) spectra of lysozyme using an excitation (EX) of 280 nm are measured while controlling the temperature, to examine the relation between temperature and the fluorescence spectrum. The FP-6500 spectrofluorometer with a ETC-272 Peltier thermostatted cell holder are used for the measurements in this experiment, using the instrument parameters outlined below.
Parameters


A buffered aqueous solution of 0.1mg/mL of lysozyme was used as the sample, the measurement performed by stirring the sample with a magnetic stirrer to ensure even sample temperatures in the cell. A temperature ramping rate of 1°C/min was controlled by the Peltier cell holder. Spectra were measured 60 seconds after reaching the set temperature.
Results
The graph below (Figure 1) shows the change in intensity vs. temperature at 340 nm. Lysozyme is known to denature at a temperature of 70°C; however the graph of fluorescence vs. temperature shows only a decrease in intensity as the temperature increases. By contrast, the EM Spectra from 40 to 90 degrees plotted using a contour view demonstrates a transition of the spectra at 70 degrees (Figure 2).


The EM spectra at room temperature have a maxima at 340 nm with a corresponding maxima at 348 nm for 90 degrees. A plot of the intensity ratios for the two wavelengths versus temperature results in a graph that demonstrates a heat-denaturation at 70°C (Figure 3), in agreement with literature values.

Required Products and Software
- FP-8200/8300/8500/8600/8700 Spectrofluorometer
- ETC-814/815 Water-cooled Peltier Thermostatted Cell Holder with Stirrer, or PTC-818 Water-cooled Peltier Thermostatted 4-position Automatic Cell Changer with Stirrer
- FWTS-872 Temperature Interval Scan Measurement program

 Download This Application