Internal Quantum Efficiency Measurement of Phosphor Powders
January 5, 2024
 Download This Application
Introduction
High-Speed Measurement System
Some white LEDs consist of two types of materials: a luminescent diode that emits a blue light in the near-UV region, and a phosphor that emits visible light from the absorption to the near-UV region. Determining a phosphor’s internal quantum efficiency is an important parameter in evaluating the emission efficiency of a white LED. A molecule’s efficiency to fluoresce is described by its quantum yield and the internal quantum efficiency is defined as the ratio of the number of photons emitted by the sample to the number of photons absorbed by the sample.
This application note illustrates the measurement reproducibility of the internal quantum efficiency of two phosphor powders from the evaluation of a white LED.
Experimental
To calculate the internal quantum efficiency, both the sample spectrum and incident light spectrum must be measured. The incident light spectrum is the emission spectrum of the excitation light scattered by a BaSO4 reflectance standard, shown in Figure 1. A calibrated light source is then used for spectral correction of the measured spectrum.
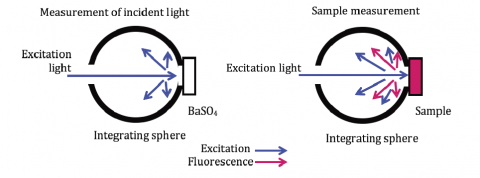
excitation scattered light using the integrating sphere.
Keywords
190-FP-0017C, FP-8500, ESC-842 Calibrated WI light source, ISF-834 Integrating sphere, Phosphors, Materials, Fluorescence, Internal quantum yield, FWQE-880 Quantum Yield Calculation program
Results
To confirm reproducibility, five repeat measurements were made for each sample (by refilling the sample cell) and are shown in Figure 2 and 3. High reproducibility was obtained for both phosphor measurements as indicated by the difference between the maximum and minimum values of the internal quantum efficiency (within 1.5% with a coefficient of variance of 0.6%), shown in Table 1 and 2.
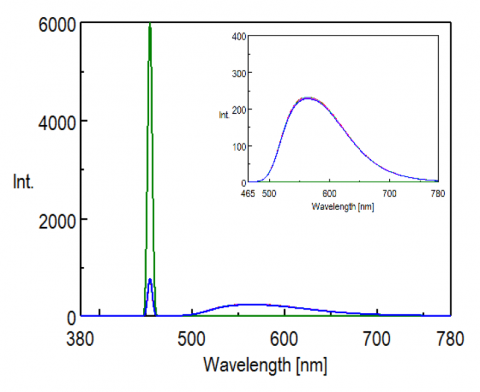
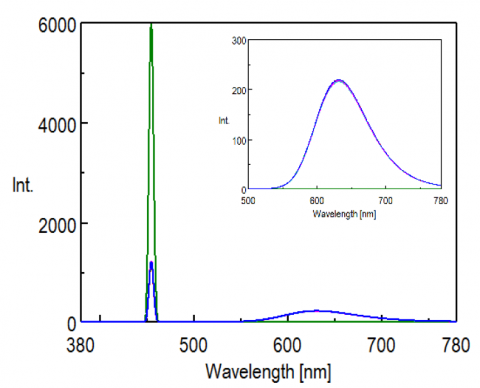
Table 1. Calculated results of the internal quantum efficiency of the yellow phosphor.
| Number of Measurement | Sample Absorption Rate | External Quantum Efficiency (%) | Internal Quantum Efficiency (%) |
| 1 | 87.6 | 80.7 | 92.1 |
| 2 | 87.4 | 80.3 | 91.9 |
| 3 | 87.3 | 79.9 | 91.6 |
| 4 | 87.2 | 79.7 | 91.4 |
| 5 | 87.1 | 79.0 | 90.7 |
| Average | 87.3 | 79.9 | 91.5 |
| SD | 0.19 | 0.64 | 0.54 |
| C.V. | 0.22 | 0.80 | 0.59 |
Table 2. Calculated results of the internal quantum efficiency of the yellow phosphor.
| Number of Measurement(%) | Absorption Rate (%) | External Quantum Efficiency (%) | Internal Quantum Efficiency (%) |
| 1 | 78.2 | 65.8 | 84.1 |
| 2 | 77.6 | 64.9 | 83.6 |
| 3 | 77.9 | 65.9 | 84.6 |
| 4 | 77.8 | 65.4 | 84.1 |
| 5 | 77.9 | 66.1 | 84.9 |
| Average | 77.9 | 65.6 | 84.3 |
| SD | 0.22 | 0.48 | 0.50 |
| C.V. | 0.28 | 0.73 | 0.60 |
Required Products and Software
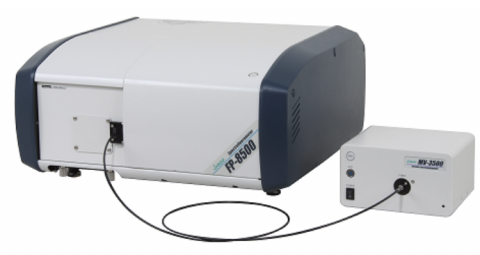
FP-8500
ESC-842 Calibrated WI light source
ISF-834 Integrating sphere
FWQE-880 Quantum Yield Calculation program
Featured Products:
-
Sophisticated optical system offering the ultimate in sensitivity, spectral accuracy, and flexibility for the most challenging materials and biological samples.
FP-8550 Spectrofluorometer
-
A powerful combination of performance, sensitivity and flexibility for biological, environmental and materials analysis.
FP-8350 Spectrofluorometer
-
Uniquely optimized for NIR applications with extended wavelength measurement to 1010 nm.
FP-8650 NIR Spectrofluorometer

Internal Quantum Efficiency Measurement of Phosphor Powders
Introduction
High-Speed Measurement System
Some white LEDs consist of two types of materials: a luminescent diode that emits a blue light in the near-UV region, and a phosphor that emits visible light from the absorption to the near-UV region. Determining a phosphor’s internal quantum efficiency is an important parameter in evaluating the emission efficiency of a white LED. A molecule’s efficiency to fluoresce is described by its quantum yield and the internal quantum efficiency is defined as the ratio of the number of photons emitted by the sample to the number of photons absorbed by the sample.
This application note illustrates the measurement reproducibility of the internal quantum efficiency of two phosphor powders from the evaluation of a white LED.
Experimental
To calculate the internal quantum efficiency, both the sample spectrum and incident light spectrum must be measured. The incident light spectrum is the emission spectrum of the excitation light scattered by a BaSO4 reflectance standard, shown in Figure 1. A calibrated light source is then used for spectral correction of the measured spectrum.
excitation scattered light using the integrating sphere.
Results
To confirm reproducibility, five repeat measurements were made for each sample (by refilling the sample cell) and are shown in Figure 2 and 3. High reproducibility was obtained for both phosphor measurements as indicated by the difference between the maximum and minimum values of the internal quantum efficiency (within 1.5% with a coefficient of variance of 0.6%), shown in Table 1 and 2.
Table 1. Calculated results of the internal quantum efficiency of the yellow phosphor.
| Number of Measurement | Sample Absorption Rate | External Quantum Efficiency (%) | Internal Quantum Efficiency (%) |
| 1 | 87.6 | 80.7 | 92.1 |
| 2 | 87.4 | 80.3 | 91.9 |
| 3 | 87.3 | 79.9 | 91.6 |
| 4 | 87.2 | 79.7 | 91.4 |
| 5 | 87.1 | 79.0 | 90.7 |
| Average | 87.3 | 79.9 | 91.5 |
| SD | 0.19 | 0.64 | 0.54 |
| C.V. | 0.22 | 0.80 | 0.59 |
Table 2. Calculated results of the internal quantum efficiency of the yellow phosphor.
| Number of Measurement(%) | Absorption Rate (%) | External Quantum Efficiency (%) | Internal Quantum Efficiency (%) |
| 1 | 78.2 | 65.8 | 84.1 |
| 2 | 77.6 | 64.9 | 83.6 |
| 3 | 77.9 | 65.9 | 84.6 |
| 4 | 77.8 | 65.4 | 84.1 |
| 5 | 77.9 | 66.1 | 84.9 |
| Average | 77.9 | 65.6 | 84.3 |
| SD | 0.22 | 0.48 | 0.50 |
| C.V. | 0.28 | 0.73 | 0.60 |
Keywords
190-FP-0017C, FP-8500, ESC-842 Calibrated WI light source, ISF-834 Integrating sphere, Phosphors, Materials, Fluorescence, Internal quantum yield, FWQE-880 Quantum Yield Calculation program
Required Products and Software
FP-8500
ESC-842 Calibrated WI light source
ISF-834 Integrating sphere
FWQE-880 Quantum Yield Calculation program