Absolute Quantum Yields Using an Integrating Sphere
May 1, 2024
 Download This Application
Introduction
Different molecular and environmental conditions not only effect whether a molecule will fluoresce or not, but can also determine the intensity of the emitted fluorescence radiation. A molecule’s efficiency to fluoresce is described by its quantum yield and is defined as the ratio of the number of photons absorbed to the number of photons emitted by a sample. There are two methods for measuring the fluorescence quantum yield: the absolute method and the relative method. The absolute method directly obtains the quantum yield by detecting all sample fluorescence through the use of an integrating sphere. The relative method compares the fluorescence intensity of a standard sample with the fluorescence intensity of an unknown sample to calculate the quantum yield of the unknown sample. Therefore, the obtained results depend on the accuracy of the standard sample’s quantum yield value.
In this application note, the fluorescence spectra for several samples will be obtained using an integrating sphere and the quantum yields will be calculated using the absolute method and compared with literature values.
Experimental
Rhodamine B was used to correct the excitation spectrum prior to obtaining the absolute quantum yield calculations. The synchronous spectrum of a standard white diffuser plate was measured between 250 – 450 nm and the emission spectrum of a calibrated halogen light source was measured from 450 – 700 nm to correct the emission spectrum.
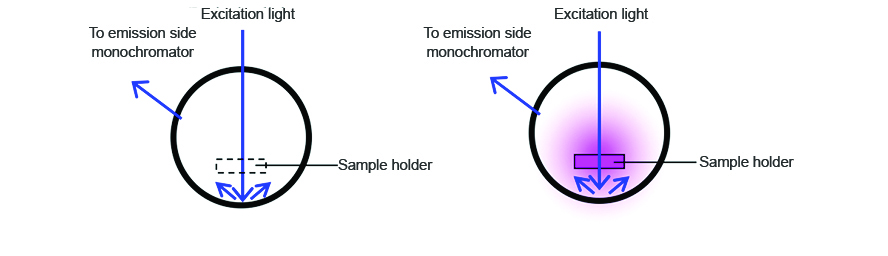
To measure the incident light using the integrating sphere, a spectrum is measured with nothing in the sample cell holder, as seen on the left in Figure 1. The sample is then placed into the integrating sphere and the spectrum is measured. The spectra of both the incident light and sample are shown in Figure 2. The incident photon (S0) peak appears in the excitation spectrum, illustrated in blue while the excitation and emission peaks indicate the number of photons unabsorbed (S1) and emitted (S2) by the sample, respectively.
 and scattered (red) photons")
Measurement Conditions
| Quinine Sulfate | Fluorescin | Tryptophan | |
| Excitation Bandwidth | 5 nm | 5 nm | 5 nm |
| Emission Bandwidth | 5 nm | 5 nm | 5 nm |
| Excitation Wavelength | 350 nm | 475 nm | 280 nm |
| Scanning Speed | 200 nm/min | 200 nm/min | 200 nm/min |
| Data Interval | 0.5 nm | 0.5 nm | 0.5 nm |
| Response Time | 05. sec | 05. sec | 05. sec |
| PMT Voltage | 350 V | 250 V | 400 V |
200 ppm of quinine sulfate in 1.0 N H2SO4, 15 ppm of fluorescein in 0.1 N aqueous NaOH, and 200 mg/mL of tryptophan in ultra pure water were prepared.
Keywords
FP0008, FP-8500, ILF-835, FWQE-880, Integrating sphere, Fluorescence, Quantum yield, Absolute method,
Results
The fluorescence spectra of quinine sulfate, fluorescein, and tryptophan are shown in Figures 3, 4, and 5, respectively.
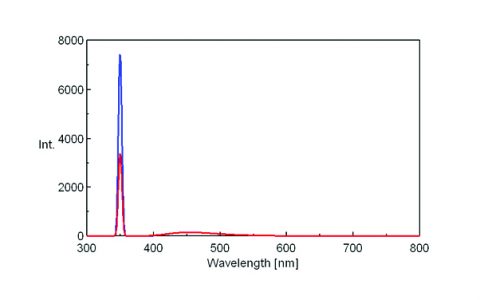
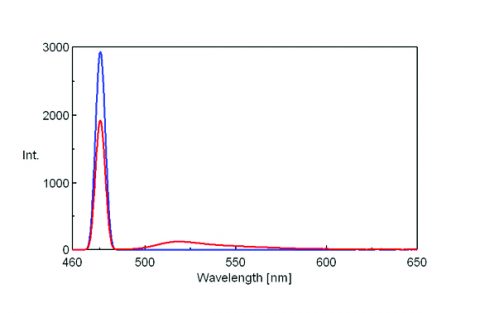
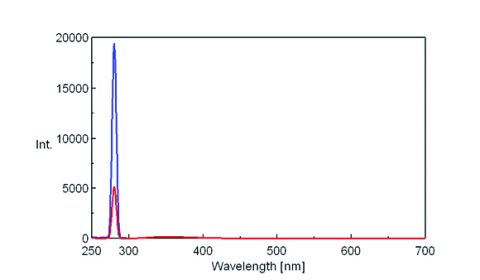
Table 1 provides the values for the area under the maxima in the spectra shown in Figures 3-5.
Table 1. Peak areas from the fluoresce spectra of the three sample solutions.
| Sample Name | Area from Incident Light [S0 | Area Scattered from Sample [S1 | Area Emitted from Sample [S2 | Scattered WL Range (nm) | Emitted WL Range (nm) |
| Quinine Sulfate | 48267 | 22538 | 14304 | 320 - 365 | 365 - 750 |
| Fluorescein | 19174 | 12515 | 6116 | 465 - 485 | 485 - 630 |
| Tryptophan | 136135 | 35842 | 12101 | 270 - 290 | 290 - 550 |
The quantum yields for the three samples were calculated by the following equations:

The calculated quantum yield results using the values in Table 1 are shown in Table 2.
Table 2. Calculated quantum yield results.
| Sample Name | Sample Absorbance | Internal Quantum Yield | External Quantum Yield | Internal Quantum Yield Literature Values |
|---|---|---|---|---|
| Quinine Sulfate | 53.3% | 55.6% | 29.6% | 50 - 57%1 |
| Fluorescein | 34.7% | 91.8% | 31.9% | 85 - 92%1 |
| Tryptophan | 73.7% | 12.1% | 8.9% | 12 - 14%2 |
Conclusion
The quantum yields of quinine sulfate, fluorescein, and tryptophan have been calculated from the fluorescence spectra of the samples. The obtained results are within range of the published literature values.
Required Products and Software
- FP-8300/8500/8600/8700 Spectrofluorometer
- ILF-835 100 mm diam. Integrating Sphere
- 1 mm liquid cell
- FWQE-880 Quantum Yield Calculation program
- ESC-842 Calibrated WI Light Source
References
1. The Spectroscopical Society of Japan, Japan Scientific Societies Press.
2. Principles of fluorescence spectroscopy, Joseph R. Lakowicz, Springer.
Featured Products:
-
Simple and sensitive system which readily accommodates routine measurements and accessories, such as spectral scanning, quantitation, and temperature control.
FP-8250 Spectrofluorometer
-
A powerful combination of performance, sensitivity and flexibility for biological, environmental and materials analysis.
FP-8350 Spectrofluorometer
-
Sophisticated optical system offering the ultimate in sensitivity, spectral accuracy, and flexibility for the most challenging materials and biological samples.
FP-8550 Spectrofluorometer
-
Uniquely optimized for NIR applications with extended wavelength measurement to 1010 nm.
FP-8650 NIR Spectrofluorometer

Absolute Quantum Yields Using an Integrating Sphere
Introduction
Different molecular and environmental conditions not only effect whether a molecule will fluoresce or not, but can also determine the intensity of the emitted fluorescence radiation. A molecule’s efficiency to fluoresce is described by its quantum yield and is defined as the ratio of the number of photons absorbed to the number of photons emitted by a sample. There are two methods for measuring the fluorescence quantum yield: the absolute method and the relative method. The absolute method directly obtains the quantum yield by detecting all sample fluorescence through the use of an integrating sphere. The relative method compares the fluorescence intensity of a standard sample with the fluorescence intensity of an unknown sample to calculate the quantum yield of the unknown sample. Therefore, the obtained results depend on the accuracy of the standard sample’s quantum yield value.
In this application note, the fluorescence spectra for several samples will be obtained using an integrating sphere and the quantum yields will be calculated using the absolute method and compared with literature values.
Experimental
Rhodamine B was used to correct the excitation spectrum prior to obtaining the absolute quantum yield calculations. The synchronous spectrum of a standard white diffuser plate was measured between 250 – 450 nm and the emission spectrum of a calibrated halogen light source was measured from 450 – 700 nm to correct the emission spectrum.
To measure the incident light using the integrating sphere, a spectrum is measured with nothing in the sample cell holder, as seen on the left in Figure 1. The sample is then placed into the integrating sphere and the spectrum is measured. The spectra of both the incident light and sample are shown in Figure 2. The incident photon (S0) peak appears in the excitation spectrum, illustrated in blue while the excitation and emission peaks indicate the number of photons unabsorbed (S1) and emitted (S2) by the sample, respectively.
Measurement Conditions
| Quinine Sulfate | Fluorescin | Tryptophan | |
| Excitation Bandwidth | 5 nm | 5 nm | 5 nm |
| Emission Bandwidth | 5 nm | 5 nm | 5 nm |
| Excitation Wavelength | 350 nm | 475 nm | 280 nm |
| Scanning Speed | 200 nm/min | 200 nm/min | 200 nm/min |
| Data Interval | 0.5 nm | 0.5 nm | 0.5 nm |
| Response Time | 05. sec | 05. sec | 05. sec |
| PMT Voltage | 350 V | 250 V | 400 V |
200 ppm of quinine sulfate in 1.0 N H2SO4, 15 ppm of fluorescein in 0.1 N aqueous NaOH, and 200 mg/mL of tryptophan in ultra pure water were prepared.
Results
The fluorescence spectra of quinine sulfate, fluorescein, and tryptophan are shown in Figures 3, 4, and 5, respectively.
Table 1 provides the values for the area under the maxima in the spectra shown in Figures 3-5.
Table 1. Peak areas from the fluoresce spectra of the three sample solutions.
| Sample Name | Area from Incident Light [S0 | Area Scattered from Sample [S1 | Area Emitted from Sample [S2 | Scattered WL Range (nm) | Emitted WL Range (nm) |
| Quinine Sulfate | 48267 | 22538 | 14304 | 320 - 365 | 365 - 750 |
| Fluorescein | 19174 | 12515 | 6116 | 465 - 485 | 485 - 630 |
| Tryptophan | 136135 | 35842 | 12101 | 270 - 290 | 290 - 550 |
The quantum yields for the three samples were calculated by the following equations:
The calculated quantum yield results using the values in Table 1 are shown in Table 2.
Table 2. Calculated quantum yield results.
| Sample Name | Sample Absorbance | Internal Quantum Yield | External Quantum Yield | Internal Quantum Yield Literature Values |
|---|---|---|---|---|
| Quinine Sulfate | 53.3% | 55.6% | 29.6% | 50 - 57%1 |
| Fluorescein | 34.7% | 91.8% | 31.9% | 85 - 92%1 |
| Tryptophan | 73.7% | 12.1% | 8.9% | 12 - 14%2 |
Conclusion
The quantum yields of quinine sulfate, fluorescein, and tryptophan have been calculated from the fluorescence spectra of the samples. The obtained results are within range of the published literature values.
Keywords
FP0008, FP-8500, ILF-835, FWQE-880, Integrating sphere, Fluorescence, Quantum yield, Absolute method,
Required Products and Software
- FP-8300/8500/8600/8700 Spectrofluorometer
- ILF-835 100 mm diam. Integrating Sphere
- 1 mm liquid cell
- FWQE-880 Quantum Yield Calculation program
- ESC-842 Calibrated WI Light Source
References
1. The Spectroscopical Society of Japan, Japan Scientific Societies Press.
2. Principles of fluorescence spectroscopy, Joseph R. Lakowicz, Springer.