Activity Measurement of Trypsin Using a Fluorescence Peptide Substrate
January 5, 2024
Introduction
In biology, proteolytic reactions occur to regulate enzyme and protein activity for metabolic to signal processing functions. Proteases are responsible for breaking down biological molecules into smaller polypeptide chains through hydrolysis. A hydrolysis reaction adds a water molecule to the location where the peptide bond has been cleaved. Scheme 1 shows the hydrolysis reaction of fluorescent dye, methylcoumarin-amide (MCA), which is bound to a trypsin peptide, Boc-Gln-Ala-Arg. Upon hydrolysis of the substrate, isolated AMC and a water-bound trypsin peptide are produced.

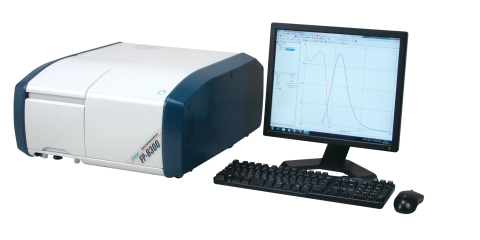
Trypsin is a protease that is commonly used in assays to determine the enzymatic activity of a molecule. After cleavage of the substrate via hydrolysis, the trypsin activity can be measured by monitoring the fluorescence intensity of the isolated product, AMC. This application note demonstrates how to obtain enzyme kinetic data using a FP-8300 and the Kinetics Analysis program.
Experimental
Measurement Conditions
| Fluorescence | Time Course | ||
| Excitation Wavelength | 360 nm | Excitation Wavelength | 360 nm |
| Emission Wavelength | 440 nm | Emission Wavelength | 440 nm |
| Excitation Bandwidth | 5 nm | Excitation Bandwidth | 5 nm |
| Emission Bandwidth | 10 nm | Emission Bandwidth | 10 nm |
| Data Interval | 1 nm | Data Interval | 0.1 sec |
| Response Time | 0.5 sec | Response Time | 0.1 sec |
| Sensitivity | 200 V | Sensitivity | 200 V |
| Scan Speed | 500 nm/min | ||
The enzyme solution was prepared by adding 10 nmol/L of trypsin bovine pancreas type VIII to a buffer solution containing 50 mmol/L Tris-HCl, 0.15 mol/L NaCl, 1.0 mmol/L CaCl2, and 0.1 mg/mL BSA.
Keywords
210-FP-0011, FP-8300, Fluorescence, STR-812 Water thermostatted cell holder, Kinetics, Enzyme activity, VWKN-772 Kinetics Analysis Program
Results
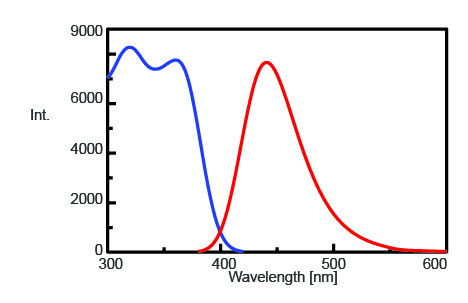
To find the maximum emission wavelength to monitor the fluorescence intensity of AMC after trypsin cleavage, the excitation and emission spectra were measured and are shown in Figure 1. The maximum emission wavelength is found to be 440 nm.
In order to standardize the measured fluorescence intensity of the enzyme solution to the concentration of isolated AMC, a titration was performed and the fluorescence measured. 0.5 mL aliquots of a 50 µmol/L AMC solution was added to a 2.5 mL enzyme solution and the initial and final concentrations of isolated AMC are summarized in Table 1.
Table 1. Isolated AMC concentrations before and after fluorescence intensity standardization.
| Initial Concentration [µmol/L] | 3 | 6 | 15 | 30 | 60 | 120 | 240 |
| Final Concentration [µmol/L] | 0.5 | 1 | 2.5 | 5 | 10 | 20 | 40 |
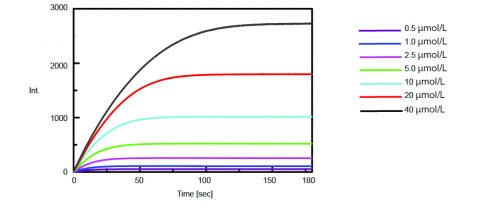
The kinetics of the trypsin activity were then obtained by measuring the fluorescence intensity of isolated AMC upon cleavage of trypsin from the substrate. Figure 2 shows the time course measurement after 0.5 mL of varying concentrations of the Boc-Gln-Ala-Arg-MCA substrate solution were added to 2.5 mL of the enzyme solution.
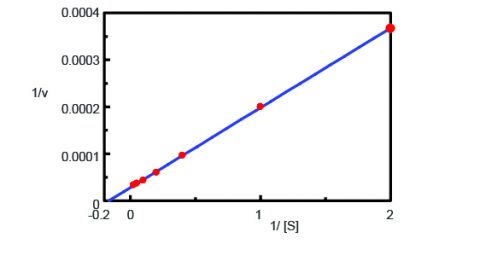
Using the Kinetics Analysis program, a Lineweaver-Burk graph (Figure 3) was plotted from the fluorescence time course measurements in Figure 2. The Lineweaver-Burk plot provides enzyme kinetic parameters such as the maximum rate of the reaction, Vmax, and the Michaelis-Menten constant, Km. Vmax describes the rate of the reaction when the enzyme is saturated with substrate while Km indicates the amount of substrate to reach the maximum reaction velocity. Vmax was 35,270 nmol/L•min-1 and Km was 5.99. The equation of the line was 1/v = 0.000270 • 1/[S] + 0.0000284.
Conclusion
This application note demonstrates the measurement reproducibility of the One Drop microsampling accessory by obtaining a calibration curve with good linearity over a wide concentration range.
Required Products and Software
- FP-8200/8300/8500/8600/8700 Spectrofluorometer
- STR-811/812 Water Thermostatted Cell Holder with Stirrer
- CSP-828/829 Sample Compartment Lid with Syringe Port
- MCB-100 Mini Circulation Bath
- VWKN-722 Advanced Kinetics Analysis program
Featured Products:
-
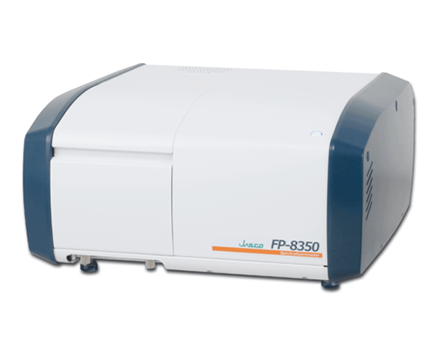
A powerful combination of performance, sensitivity and flexibility for biological, environmental and materials analysis.
FP-8350 Spectrofluorometer
-
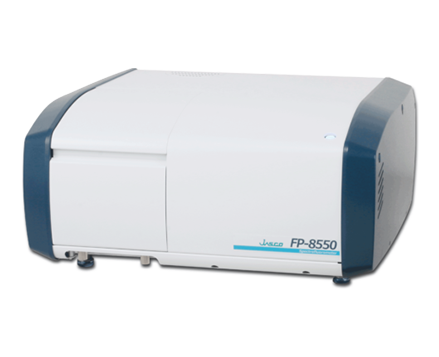
Sophisticated optical system offering the ultimate in sensitivity, spectral accuracy, and flexibility for the most challenging materials and biological samples.
FP-8550 Spectrofluorometer
-
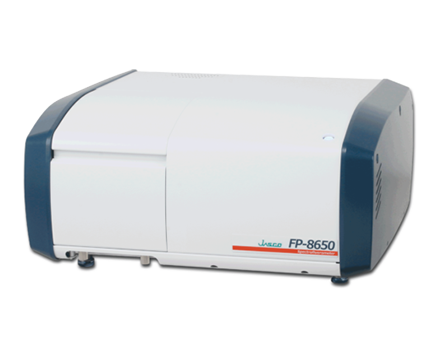
FP-8650 NIR Spectrofluorometer

Activity Measurement of Trypsin Using a Fluorescence Peptide Substrate
Introduction

In biology, proteolytic reactions occur to regulate enzyme and protein activity for metabolic to signal processing functions. Proteases are responsible for breaking down biological molecules into smaller polypeptide chains through hydrolysis. A hydrolysis reaction adds a water molecule to the location where the peptide bond has been cleaved. Scheme 1 shows the hydrolysis reaction of fluorescent dye, methylcoumarin-amide (MCA), which is bound to a trypsin peptide, Boc-Gln-Ala-Arg. Upon hydrolysis of the substrate, isolated AMC and a water-bound trypsin peptide are produced.

Trypsin is a protease that is commonly used in assays to determine the enzymatic activity of a molecule. After cleavage of the substrate via hydrolysis, the trypsin activity can be measured by monitoring the fluorescence intensity of the isolated product, AMC. This application note demonstrates how to obtain enzyme kinetic data using a FP-8300 and the Kinetics Analysis program.
Experimental
Measurement Conditions
| Fluorescence | Time Course | ||
| Excitation Wavelength | 360 nm | Excitation Wavelength | 360 nm |
| Emission Wavelength | 440 nm | Emission Wavelength | 440 nm |
| Excitation Bandwidth | 5 nm | Excitation Bandwidth | 5 nm |
| Emission Bandwidth | 10 nm | Emission Bandwidth | 10 nm |
| Data Interval | 1 nm | Data Interval | 0.1 sec |
| Response Time | 0.5 sec | Response Time | 0.1 sec |
| Sensitivity | 200 V | Sensitivity | 200 V |
| Scan Speed | 500 nm/min | ||
The enzyme solution was prepared by adding 10 nmol/L of trypsin bovine pancreas type VIII to a buffer solution containing 50 mmol/L Tris-HCl, 0.15 mol/L NaCl, 1.0 mmol/L CaCl2, and 0.1 mg/mL BSA.
Results
To find the maximum emission wavelength to monitor the fluorescence intensity of AMC after trypsin cleavage, the excitation and emission spectra were measured and are shown in Figure 1. The maximum emission wavelength is found to be 440 nm.

In order to standardize the measured fluorescence intensity of the enzyme solution to the concentration of isolated AMC, a titration was performed and the fluorescence measured. 0.5 mL aliquots of a 50 µmol/L AMC solution was added to a 2.5 mL enzyme solution and the initial and final concentrations of isolated AMC are summarized in Table 1.
Table 1. Isolated AMC concentrations before and after fluorescence intensity standardization.
| Initial Concentration [µmol/L] | 3 | 6 | 15 | 30 | 60 | 120 | 240 |
| Final Concentration [µmol/L] | 0.5 | 1 | 2.5 | 5 | 10 | 20 | 40 |
The kinetics of the trypsin activity were then obtained by measuring the fluorescence intensity of isolated AMC upon cleavage of trypsin from the substrate. Figure 2 shows the time course measurement after 0.5 mL of varying concentrations of the Boc-Gln-Ala-Arg-MCA substrate solution were added to 2.5 mL of the enzyme solution.

Using the Kinetics Analysis program, a Lineweaver-Burk graph (Figure 3) was plotted from the fluorescence time course measurements in Figure 2. The Lineweaver-Burk plot provides enzyme kinetic parameters such as the maximum rate of the reaction, Vmax, and the Michaelis-Menten constant, Km. Vmax describes the rate of the reaction when the enzyme is saturated with substrate while Km indicates the amount of substrate to reach the maximum reaction velocity. Vmax was 35,270 nmol/L•min-1 and Km was 5.99. The equation of the line was 1/v = 0.000270 • 1/[S] + 0.0000284.

Conclusion
This application note demonstrates the measurement reproducibility of the One Drop microsampling accessory by obtaining a calibration curve with good linearity over a wide concentration range.
Keywords
210-FP-0011, FP-8300, Fluorescence, STR-812 Water thermostatted cell holder, Kinetics, Enzyme activity, VWKN-772 Kinetics Analysis Program
Required Products and Software
- FP-8200/8300/8500/8600/8700 Spectrofluorometer
- STR-811/812 Water Thermostatted Cell Holder with Stirrer
- CSP-828/829 Sample Compartment Lid with Syringe Port
- MCB-100 Mini Circulation Bath
- VWKN-722 Advanced Kinetics Analysis program

 Download This Application