What is High-Performance Liquid Chromatography (HPLC)?
High‑Performance Liquid Chromatography (HPLC) is an analytical technique used to separate, identify (qualitative), and quantify (quantitative) components in a liquid sample. A high-pressure pump drives the mobile phase (solvent) through a column packed with small particles (typically 1.5-50µm) that form the stationary phase. Compounds are separated based on their affinity for the stationary phase and elute at different retention times, which are measured by a detector and displayed as peaks on a chromatogram.
Key system components:
- Solvent reservoir(s)
- Pump
- Injector/Autosampler
- Column
- Detector
- Data system
HPLC vs UHPLC: Which is Better?
High-performance liquid chromatography (HPLC) and Ultra-high-performance liquid chromatography (UHPLC) are closely related techniques, but they differ in performance, speed, and system requirements.
Key Differences
| HPLC | UHPLC | |
|---|---|---|
| Particle size | Typically 3-5 µm | <2 µm |
| Operating pressure | ~400 - 600 bar | ~600 - 1200+ bar |
| Speed/throughput | Moderate run times | Faster separations |
| Resolution | Good | Higher resolution |
| Sensitivity | Standard | Increased sensitivity |
| Solvent consumption | Higher | Lower |
| System requirements | Widely available, lower cost | Requires specialized high-pressure systems |
UHPLC achieves improved performance primarily through smaller particle sizes and higher pressures, enabling faster and more efficient separations.
When to Choose HPLC
- Routine analyses with established methods
- Budget-sensitive labs
- Applications where ultra-high speed is not required
When to Choose UHPLC
- High-throughput environments
- Complex samples requiring better resolution
- Situations where speed and sensitivity are critical
Common HPLC modes:
- Reversed‑phase (nonpolar stationary phase, polar mobile phase)
- Normal-phase (polar stationary phase, nonpolar mobile phase)
- Ion-exchange (charge based)
- Size-exclusion (size-based)
Common detectors:
- UV-Visible, fluorescence
- Refractive index
- Evaporate light scattering
- Mass spectrometry (when coupled, LC-MS)
Applications include pharmaceutical quality control, food safety testing, environmental monitoring, and forensic analysis.
The Beginning of Chromatography
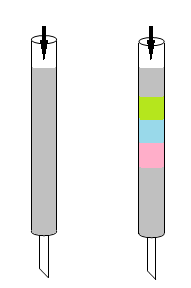
Methods for separating components of a mixture include filtration, distillation, and extraction. Chromatography was invented by the Russian botanist Mikhail Semenovich Tswett. In the early 1900s, Tswett packed calcium carbonate in a standing tube, placed pigments extracted from plants on top, and then flushed the tube with petroleum ether as a solvent (Fig. 2).
HPLC was originally known as high‑pressure liquid chromatography. By applying high pressure to push solvents through tightly packed columns, HPLC achieves faster, more precise separations than traditional low‑pressure column chromatography.
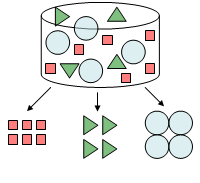
Separation Mechanism in Chromatography
A mixture is placed in a stream of liquid (petroleum ether in Fig. 3) called the mobile phase and moved through a solid medium (calcium carbonate powder in Fig. 3) called the stationary phase. The components in the mixture move with the flow of the mobile phase and interact with the stationary phase. The speed of movement depends on the strength of the interaction between each component and the stationary phase. That is, components that interact strongly with the stationary phase move slowly, whereas components that interact weakly move quickly, so allowing the components to be separated.
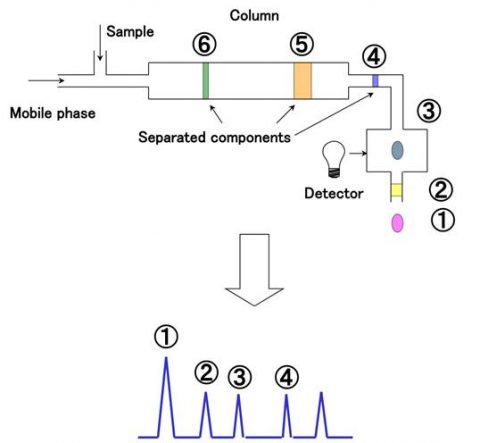
The separated components can be analyzed using different types of detectors. A UV detector, for example, can detect components based on UV absorption. The chromatogram is obtained by measuring the elution time on the X axis and the intensity of the UV signal on the Y-axis. If the measurement conditions are the same, the elution time (peak position) for the standard sample whose components are known and that for the unknown sample can be compared to identify the components for qualitative analysis. In addition, since the absorption intensity is proportional to the concentration, a calibration curve can be prepared using a standard sample, and the component concentration can be determined by measuring the peak area or height for quantitative analysis.
Factors Affecting HPLC Separations
HPLC separation performance depends on several interacting variables. Understanding how these factors influence retention time, resolution, and peak shape is essential for optimizing methods and achieving reliable results.
Key Factors
Analyte Properties
- Polarity, molecular size, and chemical structure determine how compounds interact with the stationary and mobile phases
- Ionizable compounds are especially sensitive to pH and solvent conditions
- More hydrophobic compounds typically show longer retention in reversed-phase HPLC
Stationary Phase (Column Chemistry)
- Column material controls selectivity and retention behavior
- Particle size and pore size affect efficiency and resolution
- Column aging or contamination can degrade performance over time
Mobile Phase Composition
- Solvent strength (e.g., water vs. organic modifiers like acetonitrile or methanol) directly impacts retention time
- pH and buffer choice influence ionization and peak shape
- Additives (e.g., ion-pairing agents) can improve separation of specific compounds
Temperature
- Higher temperatures generally decrease viscosity, improving flow and reducing backpressure
- Can shorten retention times and sharpen peaks
- May affect analyte stability or selectivity
Flow Rate
- Higher flow rates reduce run time but may decrease resolution
- Lower flow rates improve interaction time, potentially enhancing separation
- Must be optimized alongside column dimensions and particle size
How to Read an HPLC Chromatogram
Understanding how to interpret a chromatogram is an essential skill for anyone new to HPLC. A chromatogram is the visual output of an HPLC analysis, showing how compounds in a sample separate over time as they pass through the detector.
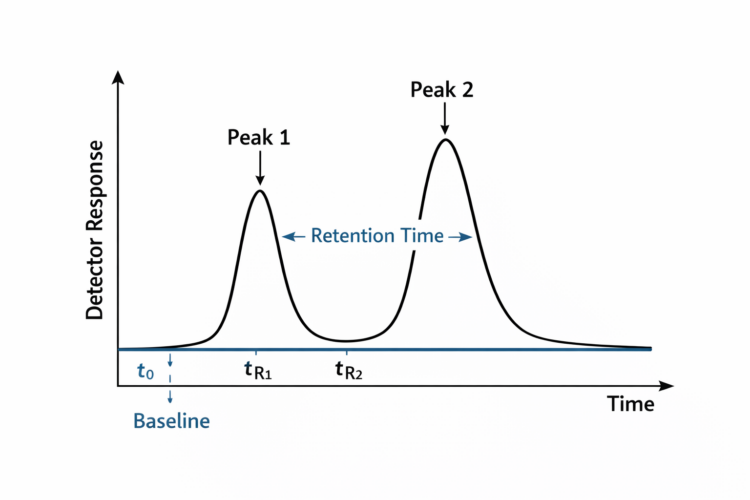
Below is a simplified example of a typical HPLC chromatogram with key features labeled.
Key Components of a Chromatogram
Baseline
In HPLC, the baseline is the flat signal observed when no analyte is being detected, representing the detector response to the mobile phase alone. A stable, smooth baseline is essential for good system performance, as it directly supports accurate and reproducible measurements. HPLC provides both qualitative and quantitative results with high precision and reproducibility: qualitative identification is based on retention times compared with standards under the same conditions, while quantitative analysis is typically determined from peak area (preferred) or peak height using calibration curves prepared from known standards. Proper system suitability, along with a stable baseline, ensures method accuracy and repeatability.
Retention Time (tR)
Retention time is the time it takes for a compound to travel from injection to detection. It is measured from the moment of sample injection to the top (apex) of a peak.
- Each compound has a characteristic tR under fixed conditions.
- Retention time helps identify compounds when compared to standards.
Dead Time (t0)
Dead time, also called void time, is the time required for an unretained compound to pass through the system.
- It represents the fastest possible elution time.
- Compounds that do not interact with the stationary phase will elute at approximately t0.
- t0 is useful for understanding column performance and calculating retention factors.
Peak Height
Peak height is the vertical distance from the baseline to the top of the peak.
- It reflects detector response intensity at maximum concentration.
- Peak height can be used for quantification in some methods, but it is more sensitive to peak shape changes.
Peak Area
Peak area is the total area under the peak.
- It represents the total amount of analyte reaching the detector.
- Peak area is most commonly used for quantitative analysis because it is less affected by peak broadening than peak height.
Quick Comparison: Peak Height vs. Peak Area
- Peak height measures how tall the signal is at its maximum.
- Peak area measures the total signal across the entire peak.
- Peak area is generally more accurate for determining concentration.
- Peak height may be useful when peaks are very sharp and well-resolved.