Overview of the Measurement Interface for the UTS-2000
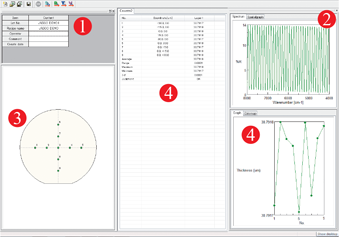
Details of the measurement Information for an analysis
- Fringe or ‘Spatialgram’ spectrum
- Map of measurement points
- Graph of the distribution of film thickness on the sample
High Measurement Reproducibility
The following table shows consecutive measurement results for a QC test of an epitaxial layer on a silicon substrate. The error of 10 consecutive measurements is better than ±0.001 µm. These figures demonstrate extremely reproducible film thickness measurement obtained using the UTS-2000.
Reproducibility of Consecutive Measurements
| Measurement No. | Measured Value (µm) | Deviation (µm) |
|---|---|---|
| 1 | 4.9001 | -0.0013 |
| 2 | 4.9014 | 0.0000 |
| 3 | 4.9010 | -0.0004 |
| 4 | 4.9019 | 0.0005 |
| 5 | 4.9015 | 0.0001 |
| 6 | 4.9018 | 0.0004 |
| 7 | 4.9011 | -0.0003 |
| 8 | 4.9014 | 0.0000 |
| 9 | 4.9017 | 0.0003 |
| 10 | 4.9021 | 0.0007 |
| Average Value (µm): 4.9014 | ||
| Standard Deviation (µm): 0.0006 | ||