Determination of the Relative Quantum Yield of Rhodamine B
May 1, 2024
Introduction
Different molecular and environmental conditions not only effect whether a molecule will fluoresce or not, but can also determine the intensity of the emitted fluorescence radiation. A molecule’s efficiency to fluoresce is described by its quantum yield and is defined as the ratio of the number of photons absorbed to the number of photons emitted by the sample. There are two methods for measuring the fluorescence quantum yield: the absolute method and the relative method. The absolute method directly obtains the quantum yield by detecting all sample fluorescence through the use of an integrating sphere. The relative method compares the fluorescence intensity of a standard sample with the fluorescence intensity of an unknown sample to calculate the quantum yield of the unknown sample. Therefore, the obtained results depend on the accuracy of the standard sample’s quantum yield value.
This application note will demonstrate how to obtain the relative quantum yield of Rhodamine B using fluorescein as a standard sample.
Experimental
In order to calculate the relative quantum yield of an unknown sample, the following information is required: the quantum yield of the standard sample, the absorption spectra of the samples, and the area of the samples’ emission spectra after spectral correction. Additionally, when the solvent of the standard sample is different from that of the unknown sample, the average refractive index value is needed. A dilution ratio is also required if the standard and/or unknown samples are diluted.
By obtaining the aforementioned parameters, the relative quantum yield of unknown sample, Φx, can be calculated using the following equation:
![]()
where Φst is the quantum yield of the standard sample, Ast and Ax are the absorbance of the standard and unknown samples, respectively, Fst and Fx are the areas of the standard and unknown emission spectra, respectively, nst and nx are the refractive indices of the standard and unknown samples, respectively, and Dx/Dst is the dilution ratio.
Prior to obtaining the relative quantum yield calculations, rhodamine B was used to correct the excitation spectrum and a calibrated halogen light source was measured from 450 to 700 nm to correct the emission spectrum.
Measurement Conditions
| Absorbance | Emission | |
| Excitation Wavelength | 500 nm | |
| Excitation Bandwidth | 2.5 nm | 5 nm |
| Emission Bandwidth | 10 nm | 5 nm |
| Scanning Speed | 200 nm/min | 200 nm/min |
| Data Interval | 1 nm | 0.5 nm |
| Response Time | 0.5 sec | 0.5 sec |
| PMT Voltage | 230 V | 430 V |
For absorbance measurements, 5400 µg/L and 72 µg/L of fluorescein and rhodamine B were dissolved in ethanol, respectively. For fluorescence measurements, 7200 µg/L and 36 µg/L of fluorescein and rhodamine B were dissolved in ethanol, respectively.
Keywords
FP0009, FP-8500, FUV-803, Fluorescence, Quantum Yield, Relative Method,
Results
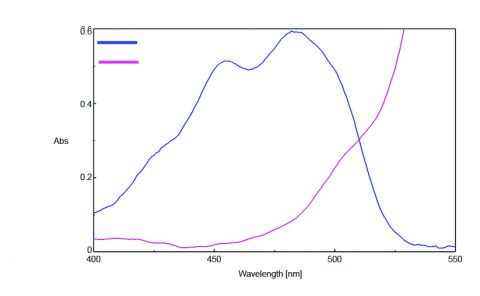
The absorption spectra of fluorescein and rhodamine B were measured using the [Absorbance Measurement] program and FUV-803 Absorbance measurement cell block. The results are illustrated in Figure 1 and indicate that the absorbance of fluorescein at 450 nm was 0.490 and the absorbance of rhodamine B at 500 nm was 0.225.
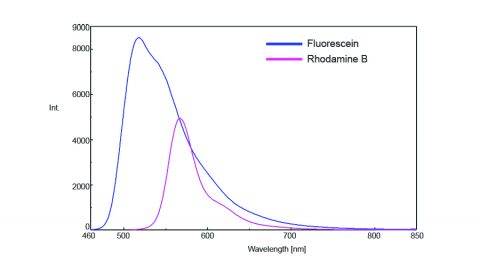
The emission spectra of rhodamine B and fluorescein were then measured and are shown in Figure 2. In order to prevent inner filter effects or reabsorption of the emitted fluorescence radiation, the sample solutions were diluted so that the sample absorbance was less than 0.02.
The area under fluorescein’s emission spectrum was 727204 and the area under rhodamine B’s emission spectrum was determined to be 243513. Since ethanol is used as the solvent for both the standard and unknown solutions, the average refractive index of the solvent is not required. However, when the solvents used are different, the published value is necessary. The standard sample solution was diluted by 75 times and the unknown sample 100 times, which makes the dilution ratio 1.33. The relative quantum yield of Rhodamine B was then calculated by applying the obtained parameters to the equation above. The calculated relative quantum yield of rhodamine B is 92% and within range of the published values of 69 – 97%1.
Conclusion
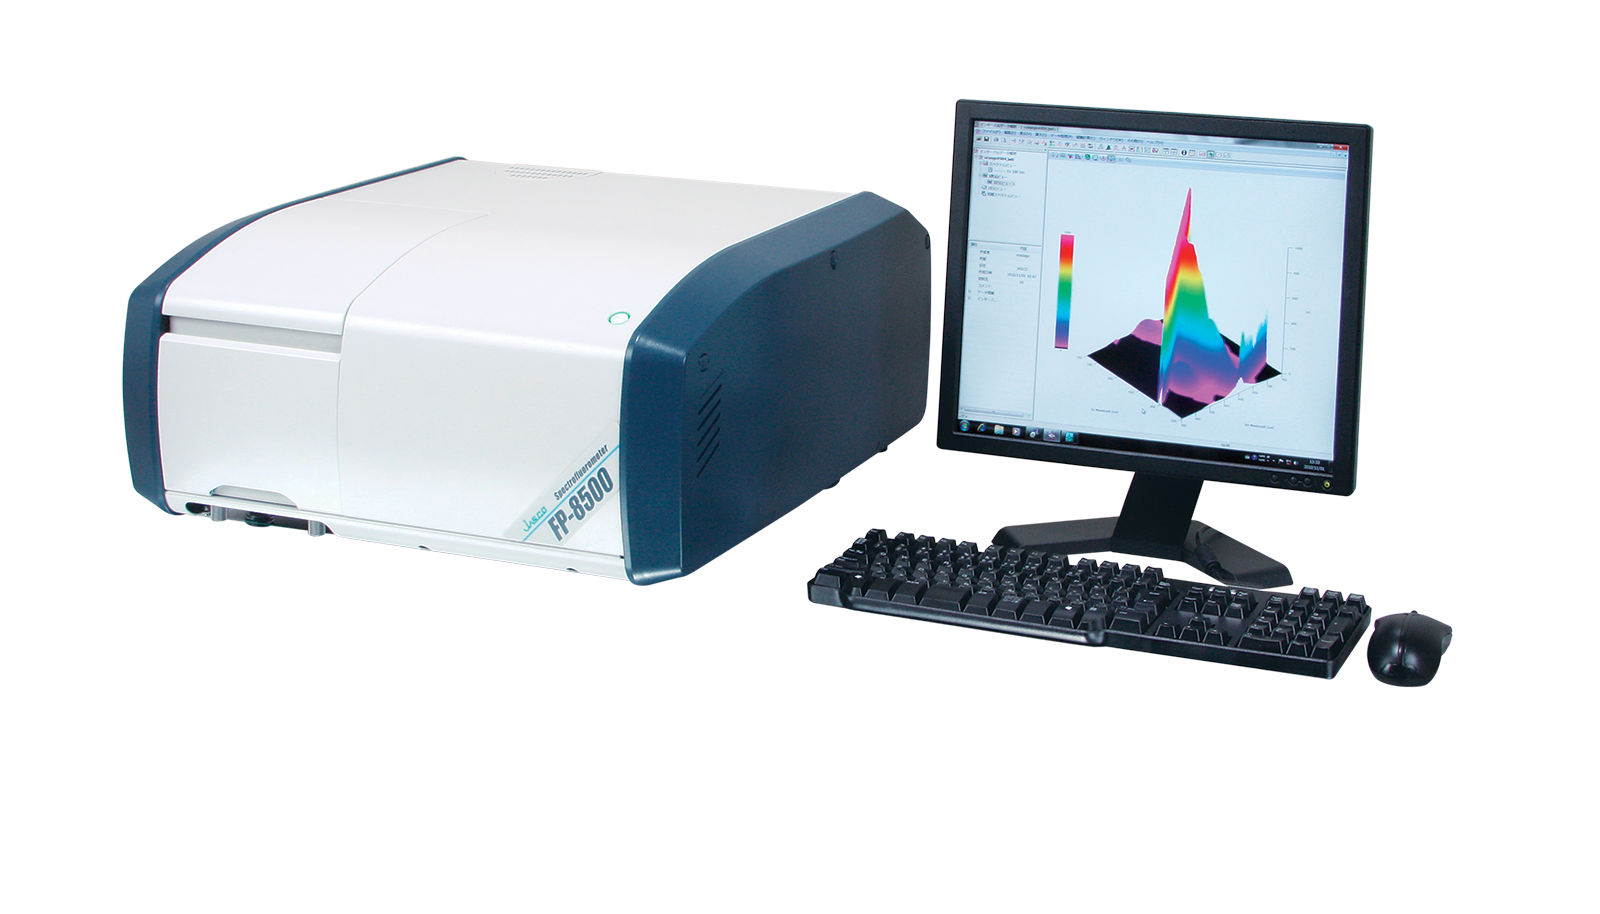
This application note demonstrates that the FP-8500 can be used to easily determine a sample’s relative quantum efficiency from a standard sample.
Required Products and Software
- FP-8200/8300/8500/8600/8700 Spectrofluorometer
- FUV-803 Absorbance Measurement Cell Holder
- ESC-842 Calibrated WI Light Source
References
1. Kazuhiko Kinoshita and Koshin Mihashi. Fluorescence measurements – Applications for Biochemical Sciences. The Spectroscopic Society of Japan, Measurement Method Series 3, Japan Scientific Societies Press, 1983.
Featured Products:
-
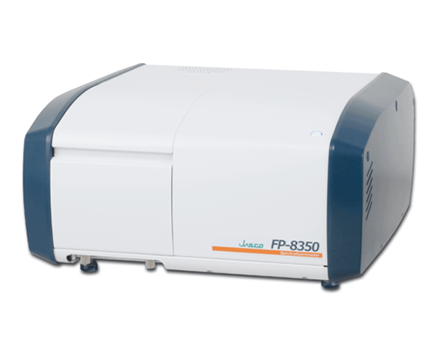
A powerful combination of performance, sensitivity and flexibility for biological, environmental and materials analysis.
FP-8350 Spectrofluorometer
-
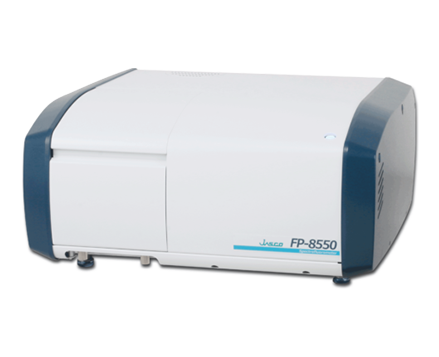
Sophisticated optical system offering the ultimate in sensitivity, spectral accuracy, and flexibility for the most challenging materials and biological samples.
FP-8550 Spectrofluorometer
-
FP-8650 NIR Spectrofluorometer

Determination of the Relative Quantum Yield of Rhodamine B
Introduction

Different molecular and environmental conditions not only effect whether a molecule will fluoresce or not, but can also determine the intensity of the emitted fluorescence radiation. A molecule’s efficiency to fluoresce is described by its quantum yield and is defined as the ratio of the number of photons absorbed to the number of photons emitted by the sample. There are two methods for measuring the fluorescence quantum yield: the absolute method and the relative method. The absolute method directly obtains the quantum yield by detecting all sample fluorescence through the use of an integrating sphere. The relative method compares the fluorescence intensity of a standard sample with the fluorescence intensity of an unknown sample to calculate the quantum yield of the unknown sample. Therefore, the obtained results depend on the accuracy of the standard sample’s quantum yield value.
This application note will demonstrate how to obtain the relative quantum yield of Rhodamine B using fluorescein as a standard sample.
Experimental
In order to calculate the relative quantum yield of an unknown sample, the following information is required: the quantum yield of the standard sample, the absorption spectra of the samples, and the area of the samples’ emission spectra after spectral correction. Additionally, when the solvent of the standard sample is different from that of the unknown sample, the average refractive index value is needed. A dilution ratio is also required if the standard and/or unknown samples are diluted.
By obtaining the aforementioned parameters, the relative quantum yield of unknown sample, Φx, can be calculated using the following equation:
![]()
where Φst is the quantum yield of the standard sample, Ast and Ax are the absorbance of the standard and unknown samples, respectively, Fst and Fx are the areas of the standard and unknown emission spectra, respectively, nst and nx are the refractive indices of the standard and unknown samples, respectively, and Dx/Dst is the dilution ratio.
Prior to obtaining the relative quantum yield calculations, rhodamine B was used to correct the excitation spectrum and a calibrated halogen light source was measured from 450 to 700 nm to correct the emission spectrum.
Measurement Conditions
| Absorbance | Emission | |
| Excitation Wavelength | 500 nm | |
| Excitation Bandwidth | 2.5 nm | 5 nm |
| Emission Bandwidth | 10 nm | 5 nm |
| Scanning Speed | 200 nm/min | 200 nm/min |
| Data Interval | 1 nm | 0.5 nm |
| Response Time | 0.5 sec | 0.5 sec |
| PMT Voltage | 230 V | 430 V |
For absorbance measurements, 5400 µg/L and 72 µg/L of fluorescein and rhodamine B were dissolved in ethanol, respectively. For fluorescence measurements, 7200 µg/L and 36 µg/L of fluorescein and rhodamine B were dissolved in ethanol, respectively.
Results
The absorption spectra of fluorescein and rhodamine B were measured using the [Absorbance Measurement] program and FUV-803 Absorbance measurement cell block. The results are illustrated in Figure 1 and indicate that the absorbance of fluorescein at 450 nm was 0.490 and the absorbance of rhodamine B at 500 nm was 0.225.


The emission spectra of rhodamine B and fluorescein were then measured and are shown in Figure 2. In order to prevent inner filter effects or reabsorption of the emitted fluorescence radiation, the sample solutions were diluted so that the sample absorbance was less than 0.02.
The area under fluorescein’s emission spectrum was 727204 and the area under rhodamine B’s emission spectrum was determined to be 243513. Since ethanol is used as the solvent for both the standard and unknown solutions, the average refractive index of the solvent is not required. However, when the solvents used are different, the published value is necessary. The standard sample solution was diluted by 75 times and the unknown sample 100 times, which makes the dilution ratio 1.33. The relative quantum yield of Rhodamine B was then calculated by applying the obtained parameters to the equation above. The calculated relative quantum yield of rhodamine B is 92% and within range of the published values of 69 – 97%1.
Conclusion
This application note demonstrates that the FP-8500 can be used to easily determine a sample’s relative quantum efficiency from a standard sample.
Keywords
FP0009, FP-8500, FUV-803, Fluorescence, Quantum Yield, Relative Method,
Required Products and Software
- FP-8200/8300/8500/8600/8700 Spectrofluorometer
- FUV-803 Absorbance Measurement Cell Holder
- ESC-842 Calibrated WI Light Source
References
1. Kazuhiko Kinoshita and Koshin Mihashi. Fluorescence measurements – Applications for Biochemical Sciences. The Spectroscopic Society of Japan, Measurement Method Series 3, Japan Scientific Societies Press, 1983.

 Download This Application