FTIR

Protein Secondary Structure Estimation by FTIR

The FTIR Secondary Structure Estimation (SSE) program estimates the secondary structure of proteins from a measured spectrum by deconvolving the protein amide I band using the multi-component analysis technique and displays the percentage of α-Helix, β-Sheet β-Turn, and Other.

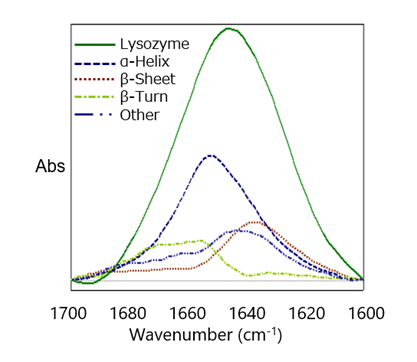
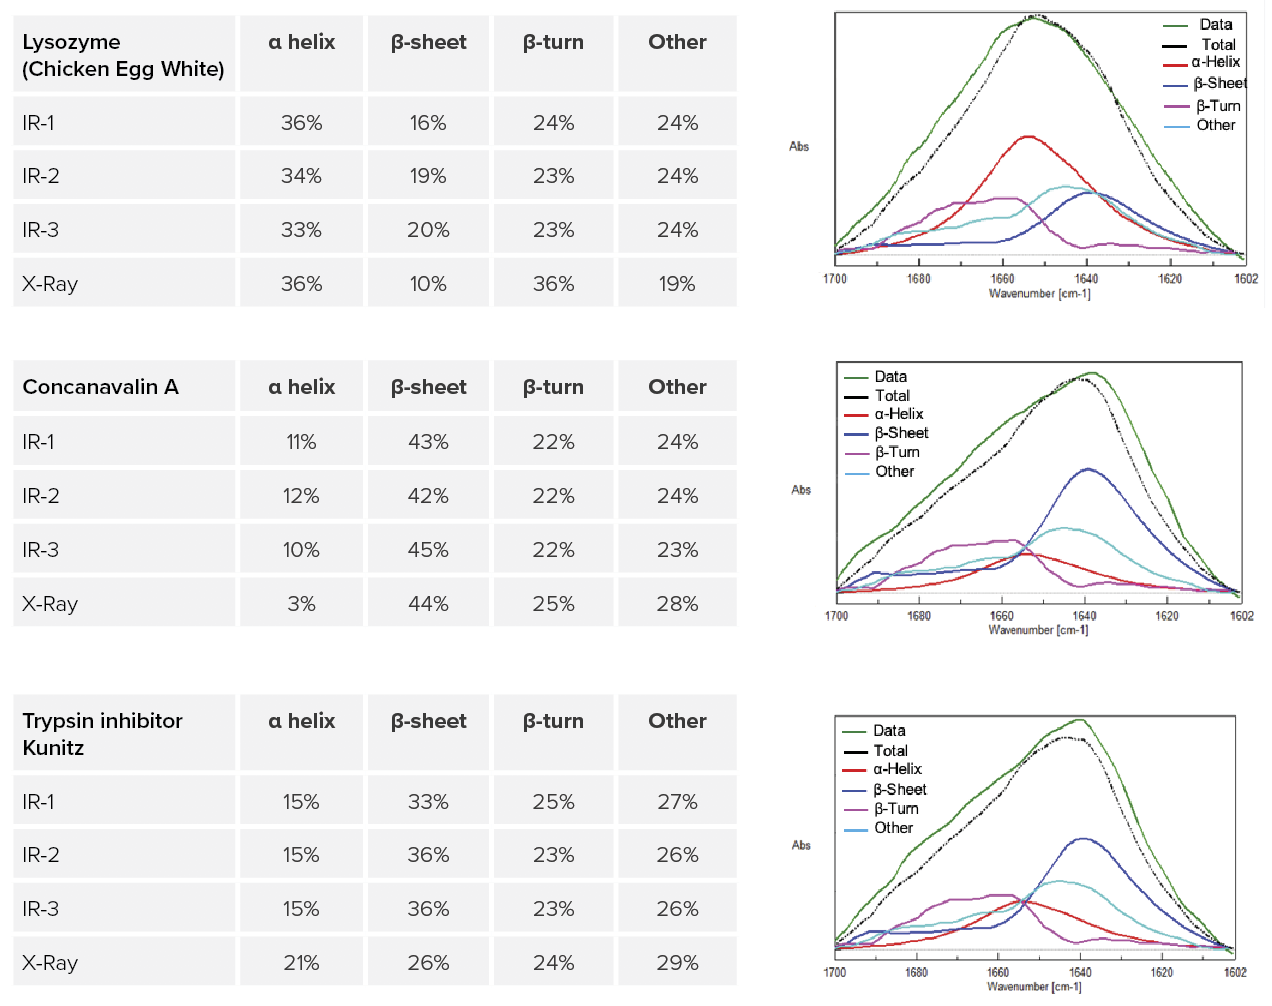
The Secondary Structure Estimation (SSE) program for FTIR includes a standard library containing 28 different types of protein spectra and that contain information about four secondary structural motifs: Helix (total number of α-helix and 3/10-helix residues), Sheet (total number of strand residues), Turn (total number of hydrogen-bonded turn residues), and Other (all other residues). The ratio of secondary structures for the proteins was calculated based on information provided by the Protein Data Bank (PDB) (as of May 2022).

Table 1. Reference Protein Molecules from the Protein Data Bank (PDB)

AzurinConcanavalin ACytochrome CElastase
FerredoxinHemoglobinImmunoglobulin GLysozyme
MyoglobinPapainParvalbuminPepsinogen
PrealbuminRibonuclease STriose phosphate isomeraseα-Chymotrypsin (Bovine)
β-Lactoglobulin (Bovine milk)Trypsin inhibitor (Soybean)Elastase (Porcine pancreas)Lysozyme (Chicken egg white)
α-Lactalbumin (Bovine milk)Cytochrome C (Bovine heart)Concanavalin A (Jack bean)Alcohol dehydrogenase (Yeast)
Immunoglobulin GOvalbumin (Hen)Carbonic anhydrase 1 (Human erythrocytes)Superoxide dismutase (Cu, Zn)

Measurement Examples

Secondary structure analysis of proteins in low-concentration samples

IR-SSE (IR protein secondary structure analysis) was performed using the difference spectrum of 0.01% lysozyme aqueous solution (Figure 1). Even at a low concentration of 0.01%, the amide I and amide II peaks are clearly separated, and the peak shapes are clearly defined, allowing the amide I peak to be used for secondary structural analysis. Structural analysis of lysozyme at low concentration (0.01%) was possible, and SSE was performed using the Amide I band in a ‘difference’ spectrum after subtraction of the water absorption. Figure 2 shows the resulting concentrations. The results of the secondary structure analysis of the difference spectra measured using a heavy aqueous solution (D2O)were reasonably consistent with those obtained by Sarver and his team [1].

[1] Sarver, R. W., Krueger, W.C., 1991. Anal. Biochem., 194, 89-100.

FTIR spectra of Lysozyme - Amide I and Amide II bands
Figure 1. Measurement results and difference spectrum of 0.01% lysozyme aqueous solution with ATR PRO PENTA X

SSE Quantitation

Structure Percentage (%)
α-Helix40
β-Sheet22
β-Turn18
Other20
Secondar Structure Estimation of lysozyme in D2O
Figure 2. SSE spectra of 0.01% lysozyme-heavy aqueous solution

Analysis of a low concentration protein aqueous solution

Aqueous protein solutions of Lysozyme (Chicken Egg White), Concanavalin A, and Trypsin inhibitor Kunitz were prepared at concentrations of 0.01% w/v. IR spectra were measured using a germanium 14 reflection  ATR PRO PENTA and the Secondary Structure Estimation (SSE) was performed after taking the difference spectrum with water.

Figure 3 shows the IR spectrum of 0.01% Lysozyme and the difference spectrum with water. In the difference spectrum, the protein amide I and amide II bands were observed.

Figure 3. IR Spectrum of 0.01% aqueous Lysozyme (left), difference spectrum (before ATR correction) (right)

The SSE result of the amide I band of the ATR-corrected difference spectrum and the reference value [2] by X-ray diffraction are shown in Figure 4. Each sample was measured in triplicate and all were in good correlation with the reference values. From this result, it was shown that ATR PRO PENTA is effective [3] for the analysis of low-concentration protein aqueous solutions.

[2] Sarver, R. W., Krueger, W. C., 1991. Anal. Biochem., 194, 89-100.
[3] Depending on the type of protein, it may adsorb on the prism and affect the results

Figure 4. Result of SSE analysis of three protein aqueous solutions (0.01% w/v)