Powered by Bioz
Concentration Effects
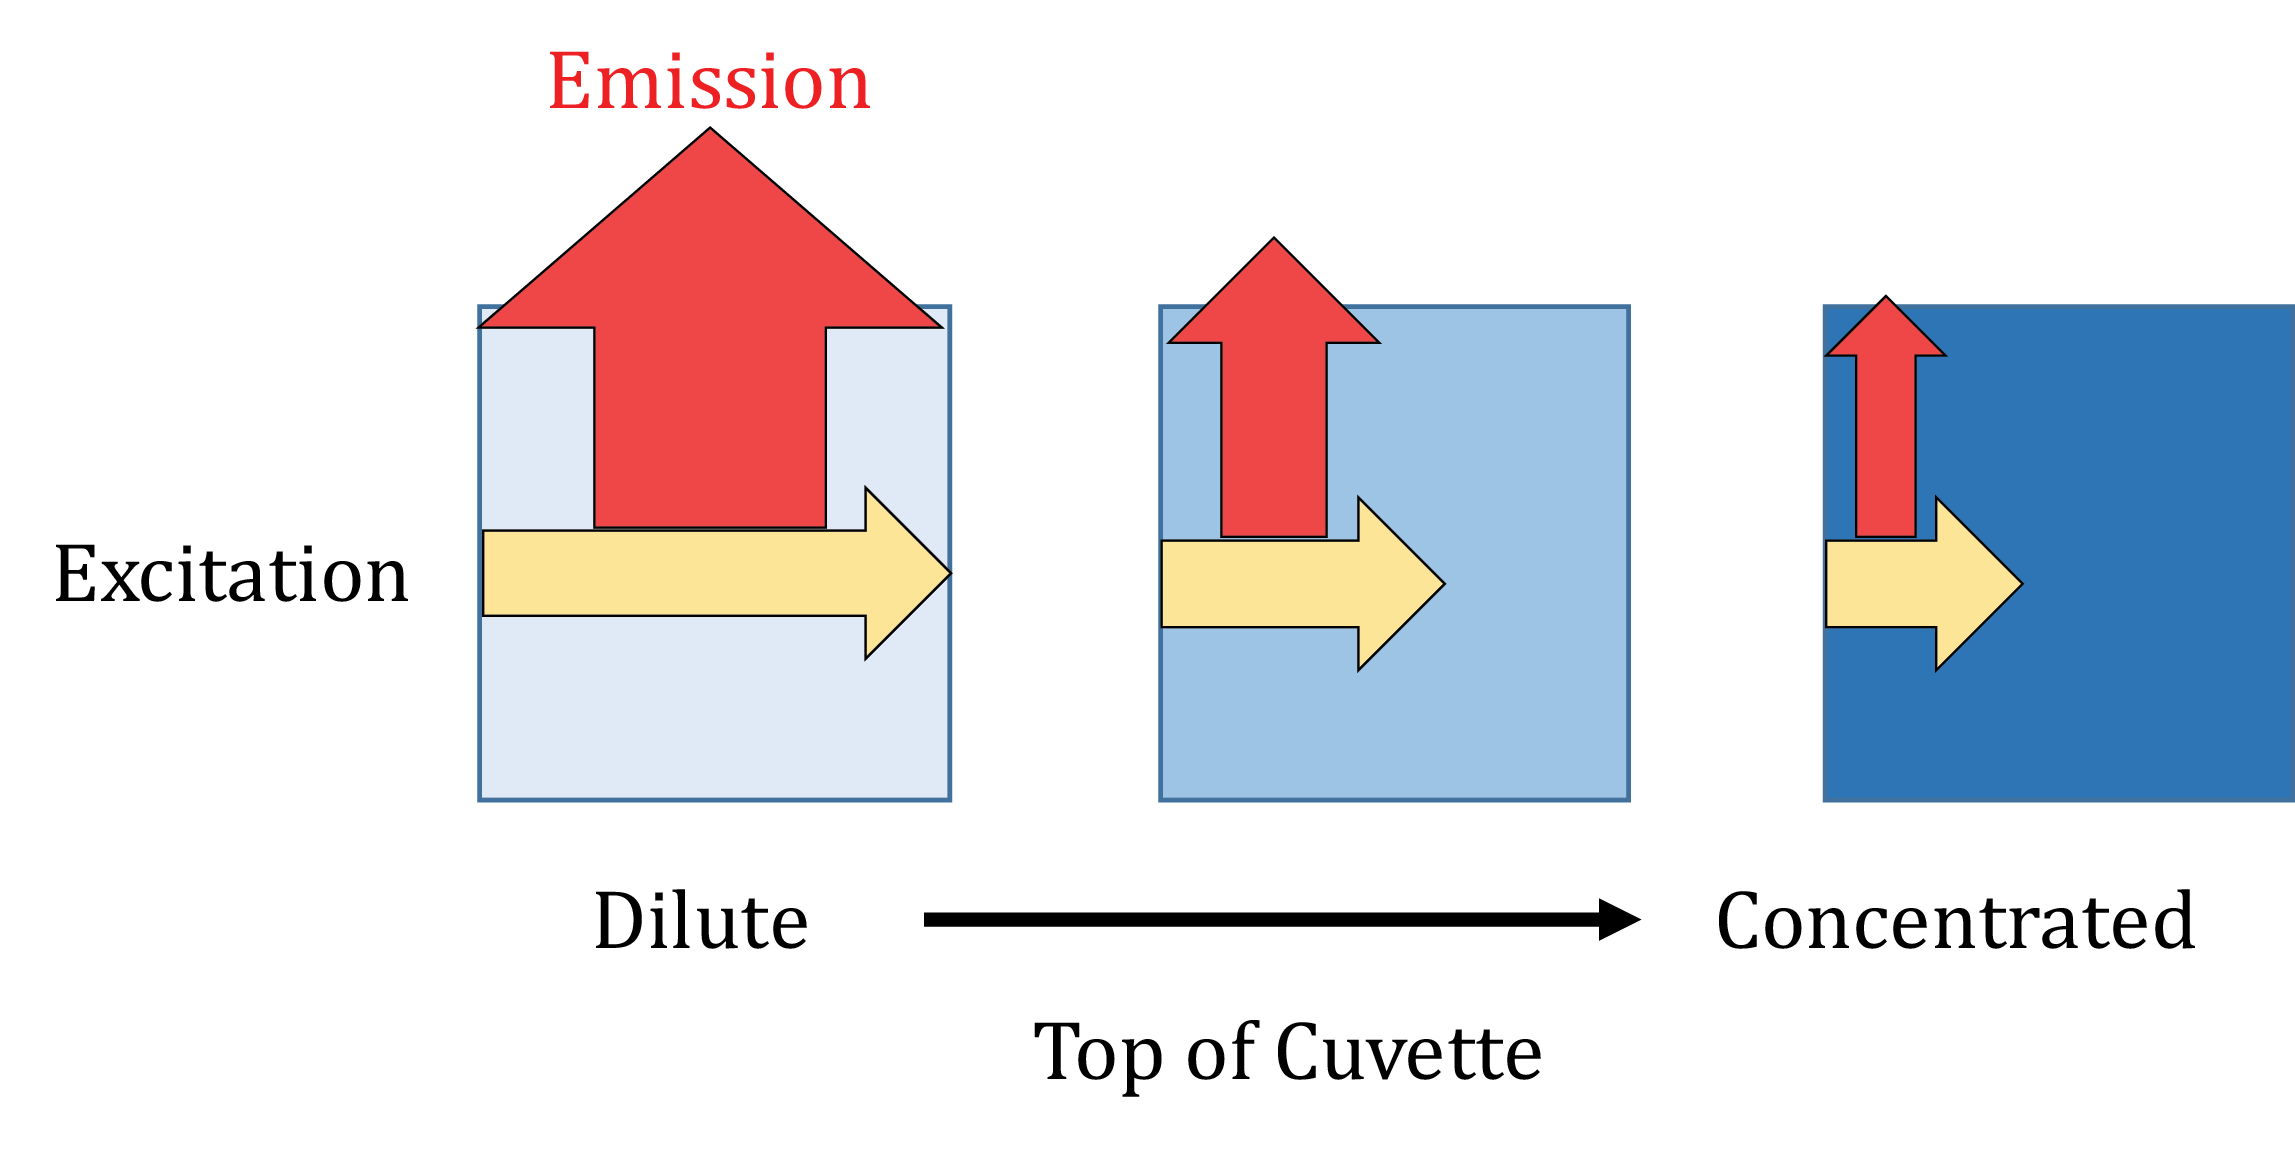 Fluorescence spectroscopy is a technique based on the Beer-Lambert equation and therefore, the sample concentration is critical to obtaining good fluorescence data. Fluorescence intensity is directly proportional to the excitation light and is linear when the sample absorbance is less than 0.05 AU in a 1 cm pathlength cell. If a sample is too concentrated, the emission light can be reabsorbed by the fluorophore attenuating the fluorescence signal at shorter wavelengths, resulting in apparent red shifted emission. Excitation light may also not fully penetrate the full width of a highly concentrated sample, which will also lead to decreased fluorescence intensities. If solutions cannot be diluted, shorter pathlength or triangular cells can be used.
Bandwidths
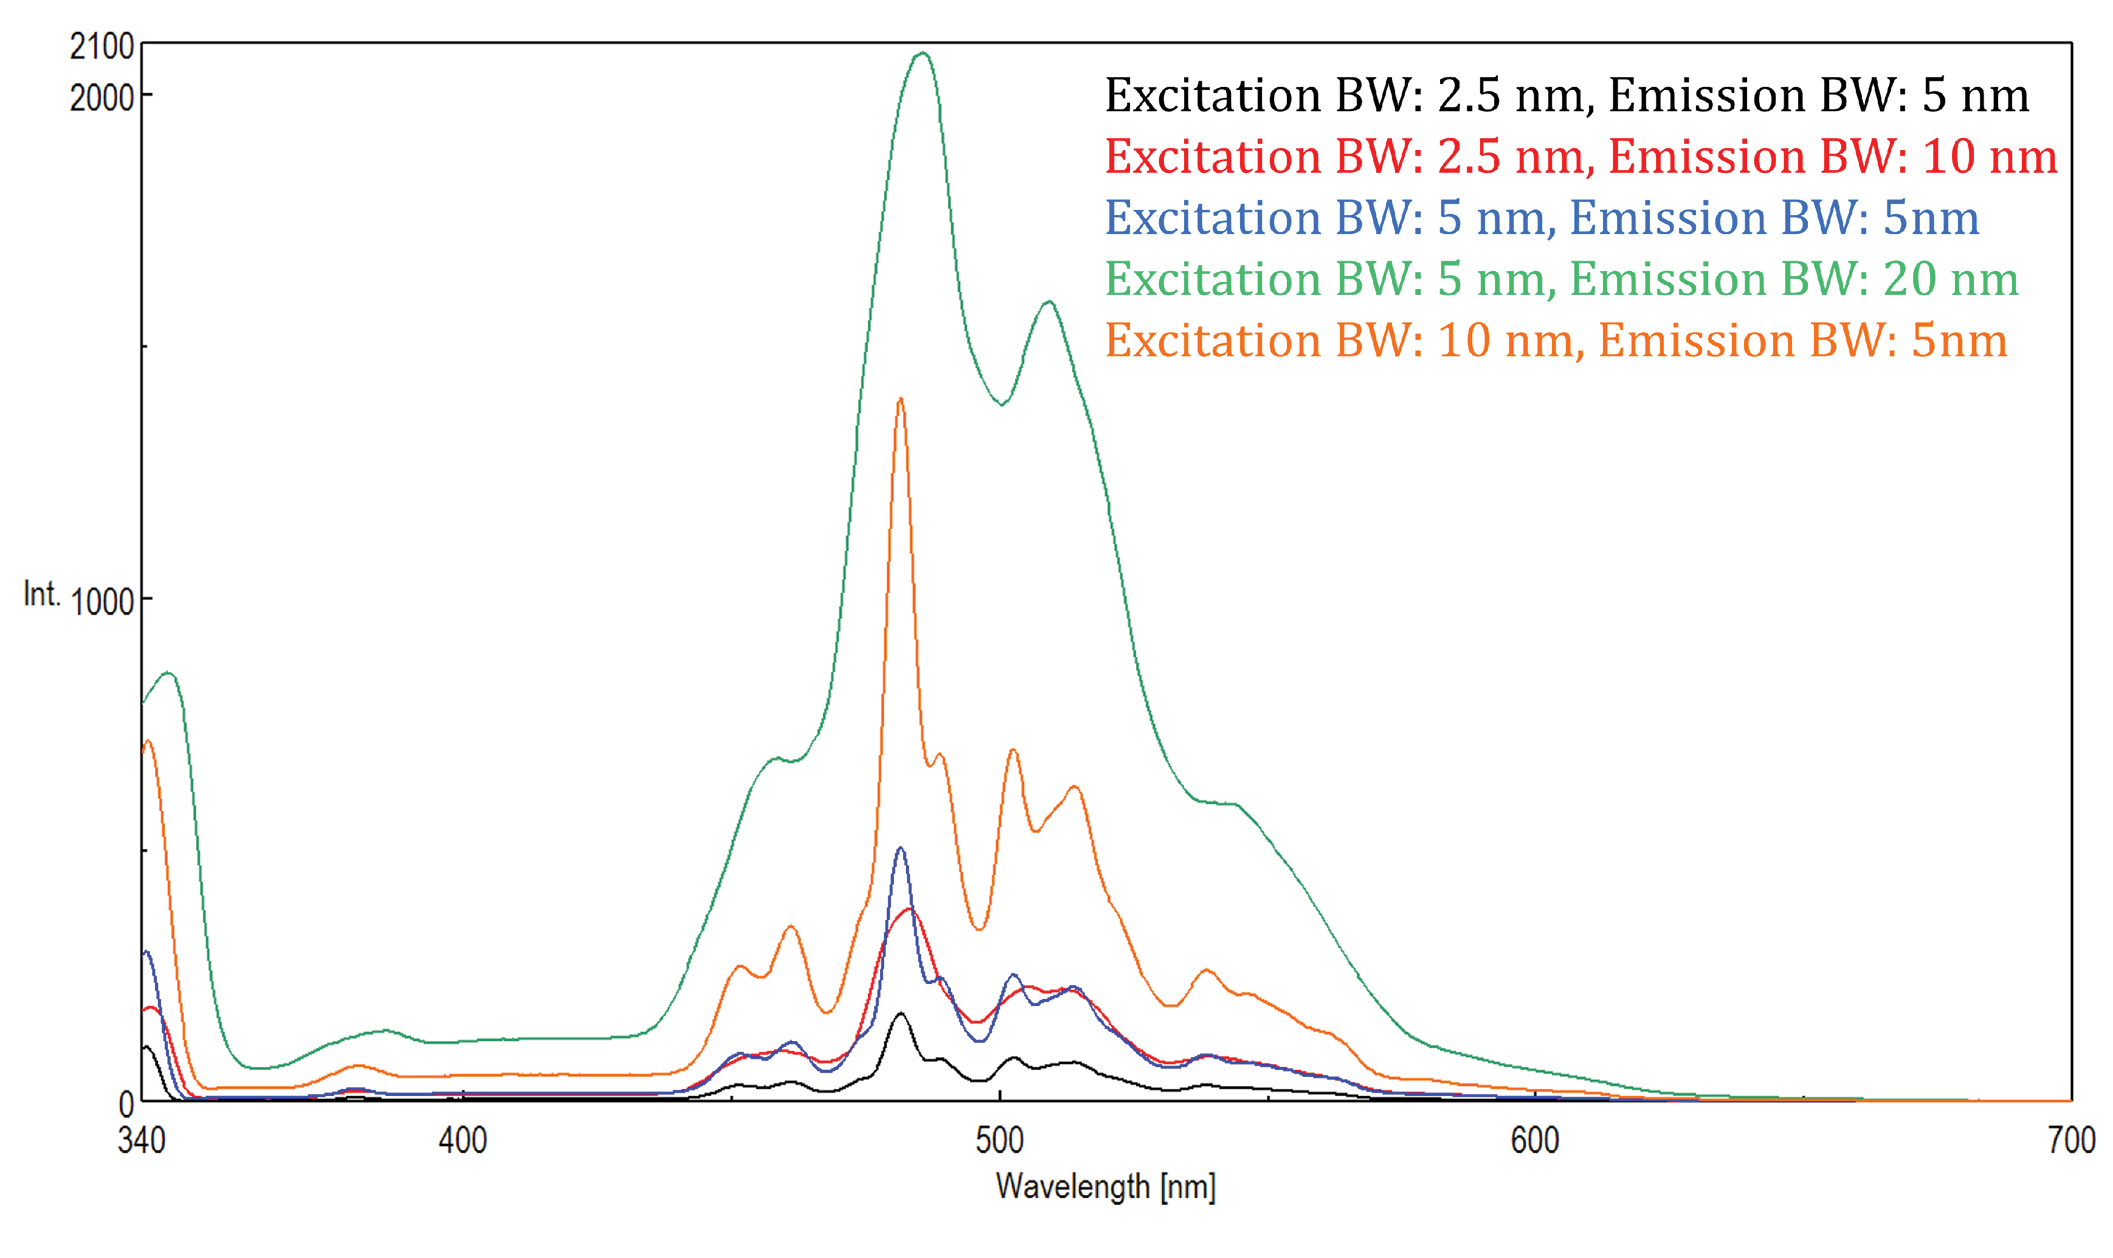 The fluorescence signal is proportional to the excitation light intensity and is greatly affected by the amount of light passed through the monochromators. Both the excitation and emission bandwidths can also be varied to optimize a sample’s fluorescence signal. The sum of the excitation and emission bandwidths should be about the spectral bandwidth (SBW) of the peak being monitored, so that all peaks are well resolved. As long as this rule of thumb is followed, the bandwidths can be opened to increase the amount of light throughput for samples with low fluorescence. The SBW can also be impacted by the Stokes shift of the fluorophore and narrower Stokes shifts may limit the range of acceptable SBWs that can be used. A combination of adjusting the detector voltage and spectral bandwidths is required to best optimize fluorescence emission to balance sensitivity and resolution needs.
PMT Voltage/Sensitivity
 Fluorescence is a highly sensitive technique because a single fluorophore can be repeatedly excited, producing many detectable photons. A photomultiplier tube (PMT) detector is used to measure these photons and the voltage applied to the detector is used to amplify the detector’s sensitivity. This voltage can be optimized to acquire data with the best signal-to-noise ratio and is adjusted using the Sensitivity parameter. If the correct sample concentration has been selected and the fluorescence intensity is very low, the instrument’s sensitivity setting can be increased to maximize the signal.
Scatter Artifacts
Scattered light can give rise to artifacts, distorting the fluorescence spectrum. The three most common types of scatter seen in fluorescence spectra are Rayleigh, 2nd order, and Raman. Rayleigh scattering is the scattered excitation light and therefore peaks at the excitation wavelength. Second order bands result from higher order scatter from the monochromators and are observed at twice the excitation wavelength. Raman is inelastic scattering due to solvents and peaks at a fixed energy from the excitation wavelength. To differentiate Raman scattering from a fluorescence peak, the excitation wavelength can be varied in 5 to 10 nm increments and if the peak in question shifts with the excitation wavelength and decreases in intensity, then that peak is due to Raman scatter. You can also check to see if the peak is in the blank solvent spectrum. If it is, there is a chance it is a Raman peak. If the fluorescence peak is too close or overlapping with either the Raman or Rayleigh scatter, the bandwidths and/or excitation wavelength can be adjusted to shift the scatter off the fluorescence peak. These effects are most prominent for very low fluorophore concentrations and especially for solids and highly scattering solutions, like proteins, microspheres, and nanoparticles.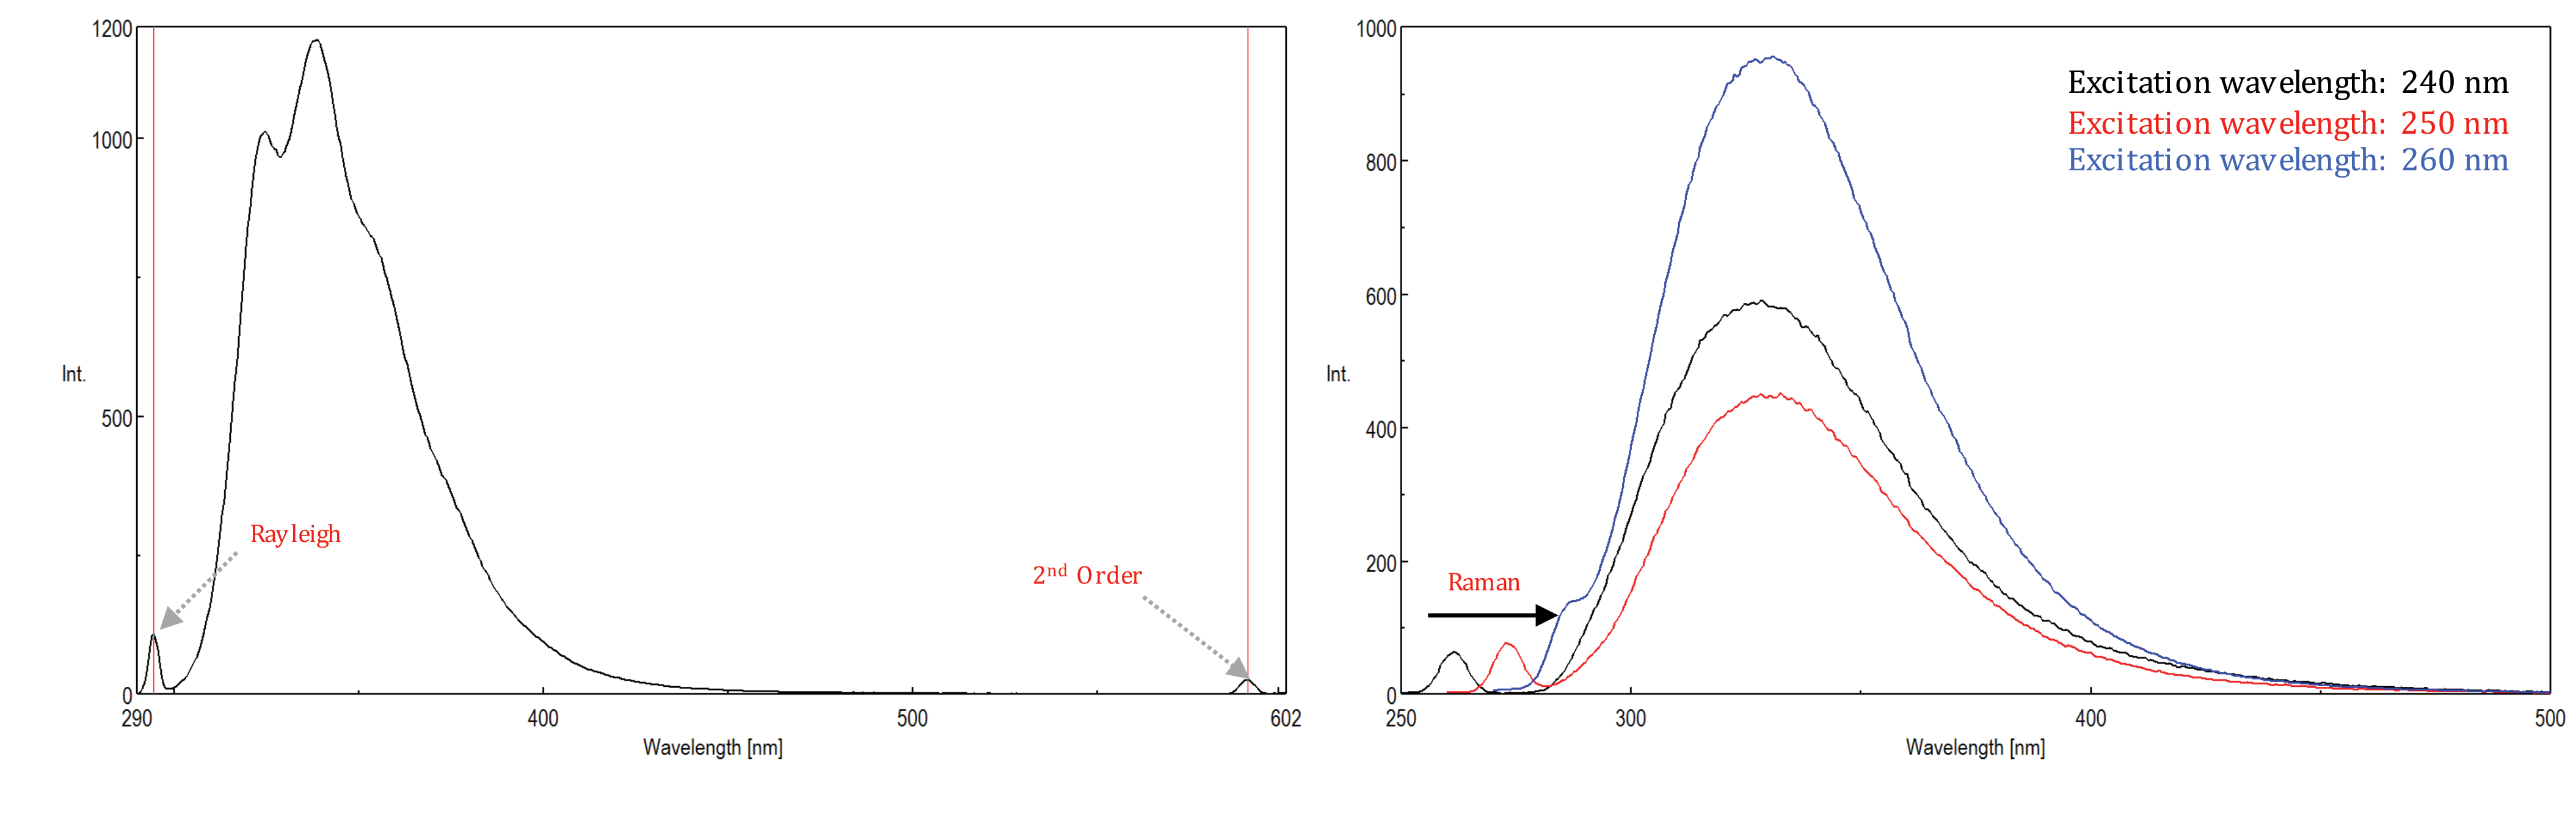
 Click here to request a full size poster for your lab.
Click here to download a printable pdf version.