


Confocal Raman Microscopy
 Confocal Raman microscopy offers a number of significant advantages over other spectroscopic or visible microscopy techniques. First, Raman microscopy can be used for chemical or molecular analysis of unknown compounds in a small area, down to less than a micron. Second, combined with a moving stage, Raman microscopy can map areas of a sample, useful for samples with patterns or two different regions. Third, Raman can perform depth profiling, allowing the user to see layers of a sample without sample preparation. Raman microscopy is a useful tool for the identification and mapping of multilayer samples, minerals, particulate identification, and chemical distribution to name a few applications.
Confocal Raman Microscopy Principles
Figure 1 depicts a general layout for Confocal Raman microscopy. Raman utilizes a laser (a) as a source due to weak Raman scattering (stokes and anti-stokes shifts), which is about a million times weaker than typical absorption spectroscopy. A beamsplitter (b) splits the light, with the beam path focused onto the sample (c) through an objective lens (d). The beam can be split between a camera (e) and the spectrograph (f) for observation or measurement respectively, and after passing through a rejection filter to remove the Rayleigh scatter, the stokes (and anti-stokes) wavelengths are diffracted by a grating (g) onto a detector (h), either a CCD or an InGaAs array.

Spectral Resolution
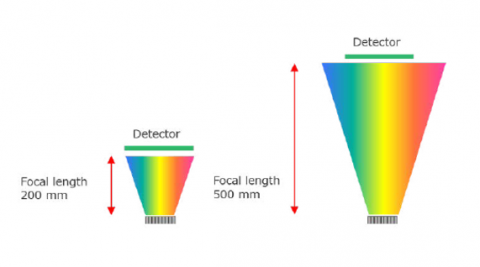
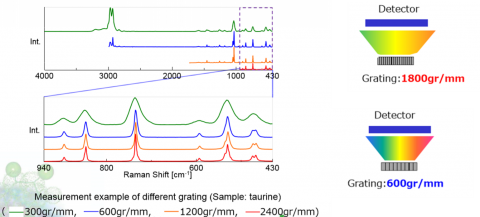
Spectral resolution in a Confocal Raman microscope system is defined by several factors – focal length of the spectrograph, number of lines on the grating, and resolution of the elements in the detector. Focal length is the distance between the focusing mirror and the detector, longer focal length provides greater resolution due to the wider separation of light (Figure 2). The grating is an optical component that consists of periodic grooves at a specific angle (blaze angle) to match the wavelength of the excitation laser. Resolution increases with a greater number of lines (Figure 3), given as lines or groove per millimeter on the surface (a common grating is 900 gr/mm) and the blaze wavelength. Light striking the grating surface is dispersed following the Huygens–Fresnel principle. The number of elements of a detector also determines resolution with increasing elements giving increased resolution but less sensitivity.
Spatial Resolution
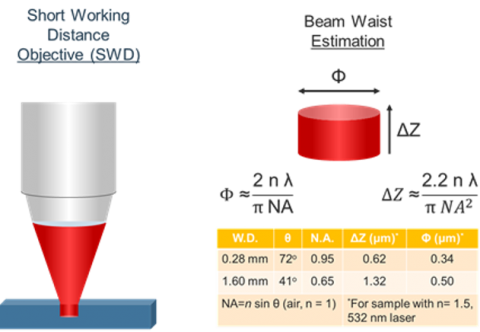
In Confocal Raman microscopy, spatial resolution is extremely important in being able to discriminate small structural differences in the sample. Optical microscope objective lenses (up to x100 magnification) are used to observe the sample and pass the Raman scatter to the spectrograph. This means that many of the factors and techniques that affect light microscopy can be applied to Raman microscopy. Spatial resolution is constrained by the resolving power of the objective lens. The spot size for a microscope measurement is dependent on three variables: refractive index of the sample (n), the numerical aperture of the objective (NA), and the wavelength of the incident light (see Figure 4). The estimation of the beam waist, or focal plane, the volume does not include contributions from scattered light to or from the sample.
Lasers
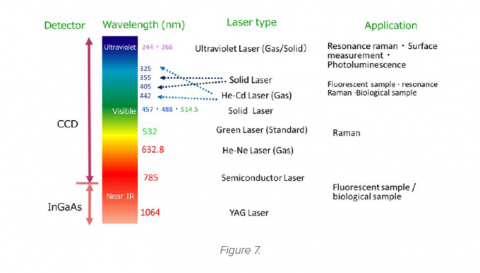
Selection of the laser wavelength is important in obtaining meaningful Raman data; the excitation wavelength can be selected from the UV though visible to near IR, with a range of power options depending on the application. Multiple lasers with a variety of wavelengths can often be installed in a Raman microscope to allow data to be measured for different types of sample (Figure 5). A popular laser wavelength is 532 nm because it offers relatively high Raman excitation energy with low fluorescence. However, for greater reduction in fluorescence, longer wavelength lasers (which cause less electronic excitation) such as 785 nm and 1064 nm are often used. Less frequently required UV lasers offer the additional benefit of “resonance Raman”, an excellent choice for carbonaceous materials.
Rejection Filters
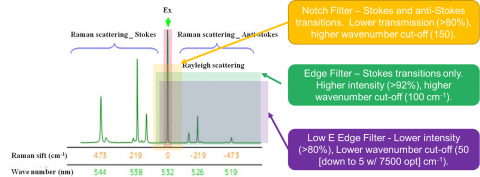
Rejection filters are used to remove or reduce the Rayleigh scatter of the probe laser’s wavelength before it reaches the spectrograph. There are three major types of filters: edge, notch and low-E filters (Figure 6). Edge, the most commonly used, rejects both the Rayleigh scatter as well as the entire anti-Stokes region. The intensity is typically >92 % and the cut off is around 100 cm-1. If measurement of the anti-Stokes region is also desired, then a notch filter may be used at the cost of intensity (>80 %) and cut off (150 cm-1). The Low-E filter is for studies requiring low wavenumber studies (5-50 cm-1 cut off) and also have a lower intensity (>80 %).
Detectors
Detectors are a key part of a Raman microspectrometer. Detectors convert photons into a usable electronic signature. A Charge-Coupled Device (CCD) Is a lattice of pixels (Figure X, a) that convert light to electronic signals. These pixels are then binned in a horizontal then vertical registers and the data is sent to a computer. The CCD is the most common detector used in Raman spectroscopy. An Electron Multiplied Charge Coupled Device (EMCCD) works similarly to a regular CCD except during the vertical data transfer the signal is multiplied as it passes through a special material (Figure X, b). The consequence of this is a 50x multiplication of gain allowing for faster scans (shorter accumulation times). InGaAs detectors use a linear array (as opposed to the grid used in CCDs) of indium gallium arsenide to detect light in the near-infrared region. These detectors are dedicated to Raman spectroscopy using a 1064 nm laser.
Confocal Raman Microscopy Sampling
Fluorescing Samples
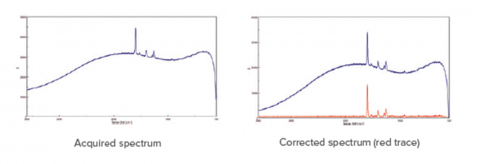
Fluorescence is a common side effect in Raman measurement that can occur in either the target molecule or the surrounding matrix. There are three physical methods for reducing fluorescence. The first is to select a laser wavelength at which fluorescence does not occur, this is typically at longer wavelengths (e.g. 785 or 1064 nm). The second method is to use aperture size and shape to mask as much of the sample matrix as possible to eliminate matrix fluorescence. The third method is to expose the sample to high wattage until the matrix no longer fluoresces (photobleaching). A software option is the use of a fluorescence rejection algorithm, which is highly effective at removing the broader fluorescence spectrum, leaving the sharper Raman peaks in a clean baseline, as shown in Figure 7. This feature can be used either automatically during measurement for fast imaging, or post run for more additional data processing. This often works well for samples with strong fluorescence when using shorter wavelength lasers (e.g. 405 or 457 nm), which give a more intense Raman signal.
Minerals
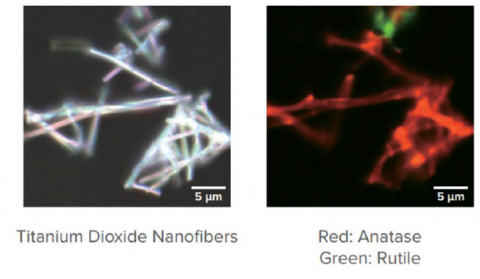
Confocal Raman microscopy enjoys many practical benefits over FTIR and XRD with respect to mineral analysis. The metal oxide bonds present in many mineral samples are highly absorbing in Raman. These bonds appear in the 200-1000 cm-1 spectral region for Raman. While XRD can identify polymorphs, it cannot be used at the microscopic level. Raman bands of polymorphs are easy to distinguish, each giving its own representative spectra. Figure 8 shows a Raman image of rutile and anatase TiO2 fibers on a substrate.
Multilayer Samples
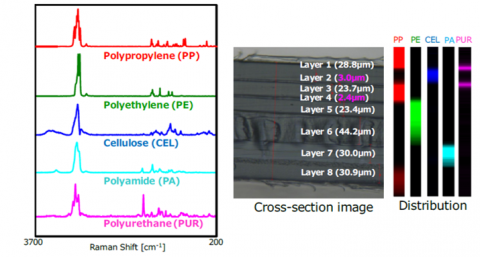
Confocal Raman microscopy can be used to determine layers in a multi-layer sample. Firstly, a cross-section of a sample can be made and the sample mapped across the sections (Figure 9). For very thin layers (<3 μm), confocal microscopy is very effective due to its high spatial resolution in the XY directions. Thin layers (<30 μm) can be probed without sample preparation with depth profiling by confocal microscopy. Since scattered light in the z dimension is filtered out, a map in the z-direction can be obtained simply by moving the stage in the z direction.
Particulates
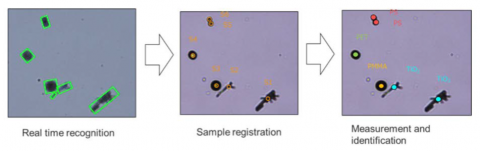
Another application for Confocal Raman Microscopy is analysis of small particles. These particles may be inclusions embedded in a matrix, filtrates on a filter, or particles on a substrate. The size ranges from ~1 μm and up, depending on the laser and objective used. Modern software/hardware can now find particles on a surface and label them via a library search automatically. Figure 10 shows this process for particles on a substrate.
Chemical Mapping
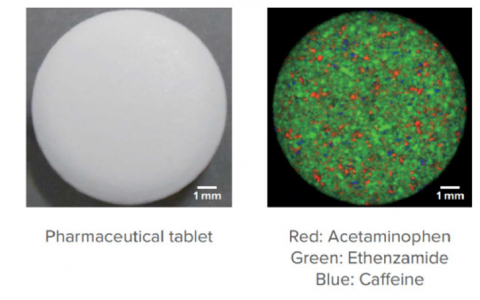
Another application for confocal raman imaging is chemical mapping. A scan is taken at each point on a sample’s surface and matched against a library. The data then can be further analyzed using chemometric analysis to give compositional data for the sample. This can be further enhanced by using a fast mapping stage and fast detector for rapid analysis (32,000 measurement points in around 16 minutes). Figure 11 shows a Raman image showing constituents in a pharmaceutical tablet.
Differential Interference Contrast Observation (DIC)
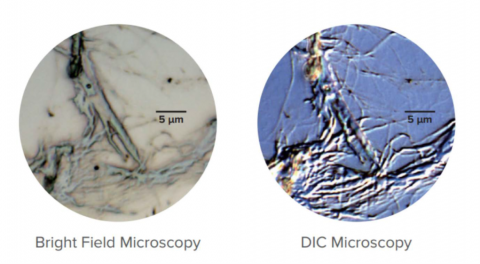
Differential Interference Contrast Observation (DIC) uses polarized light and a Nomarski-modified Wollaston prism to enhance the observation of images with low contrast. DIC uses phase difference in light to stereographically view very small step differences in the submicron order. Nomarski prisms are used to create bright and dark contrast from the differences in the two beams directly reflected at the sample’s surface. This technique can be applied equally to low-contrast biological and non-biological samples that have small unevenness in the surface, an example may be seen in Figure 12.
Polarized Light Observation (PLO)
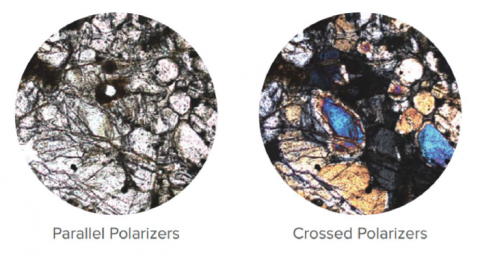
Polarized Light Observation (PLO) exploits the differences in anisotropic properties to enhance the observation of materials with low contrast. PLO uses two polarized elements located in the optical path on each side of the sample being observed. It is particularly useful for samples such as biomolecules and biostructures, minerals, ceramics, mineral fibers, extended polymers, liquid crystals, etc. DIC of a mineral sample may be seen in Figure 13.
Probes
For samples that are too large for a microscope or to do in-situ liquid studies, Raman probes may be used. Probes are composed of a cladding material surrounding the core material. Light undergoes total reflection in the core material (η1) as the light bounces off the cladding material (η2) and creates a cone of acceptance (α) (Figure 14). The numerical aperture of the fiber (NA) is equivalent to sin(α). Since some light is lost with each internal reflection, shorter probes are desirable.