


 Powered by Bioz
IRT-5000 Series FTIR Microscopes
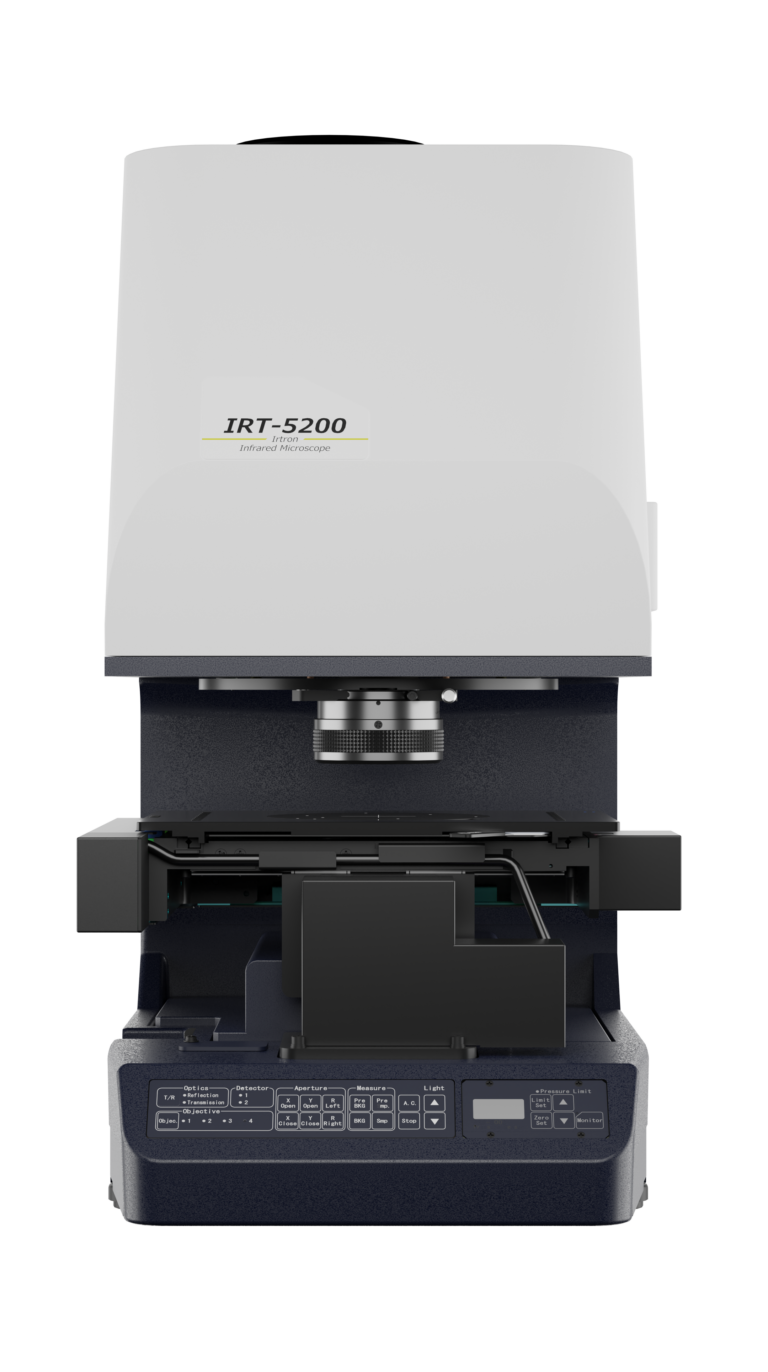
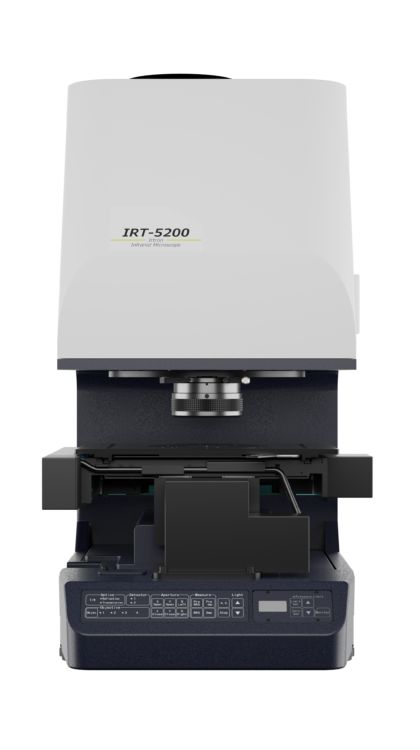
IRT-5200 FTIR Microscope
Includes a high-sensitivity mid-band MCT detector, a second detector can be added as option. IQ Mapping allows single-point, multi-point, line, area, and ATR mapping measurement without moving the sample stage. An optional automatic XYZ stage provides auto-focus and mapping or imaging analysis of larger sample areas.
- IQ Mapping
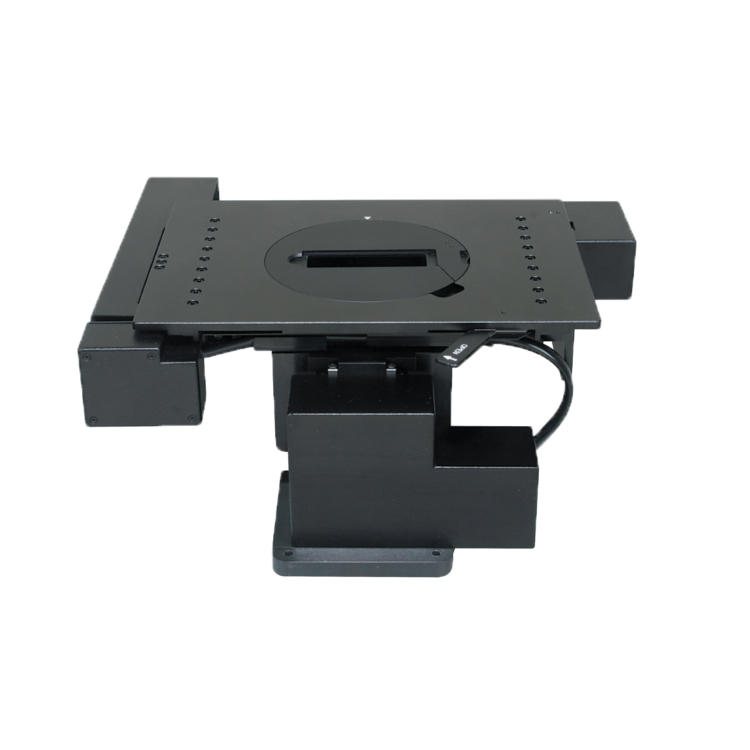
- Optional automatic XYZ sample stage
- Optional dual detector, with user-exchangeable detectors using a ‘cassette’ system
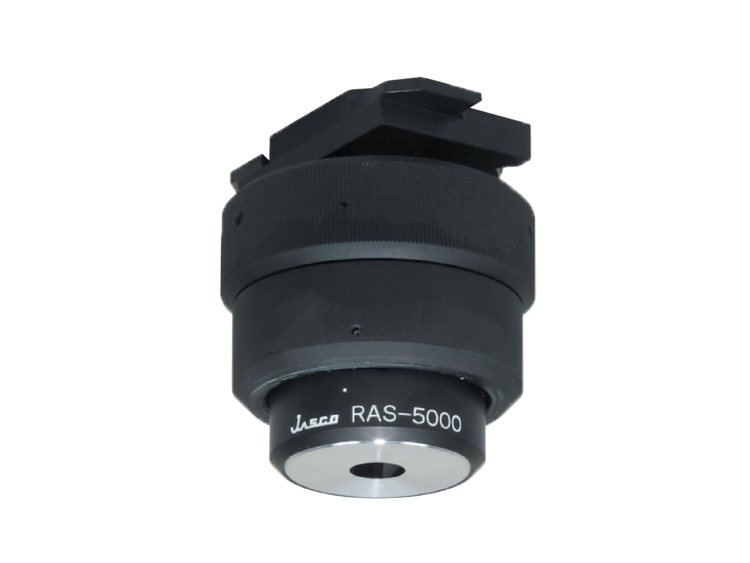
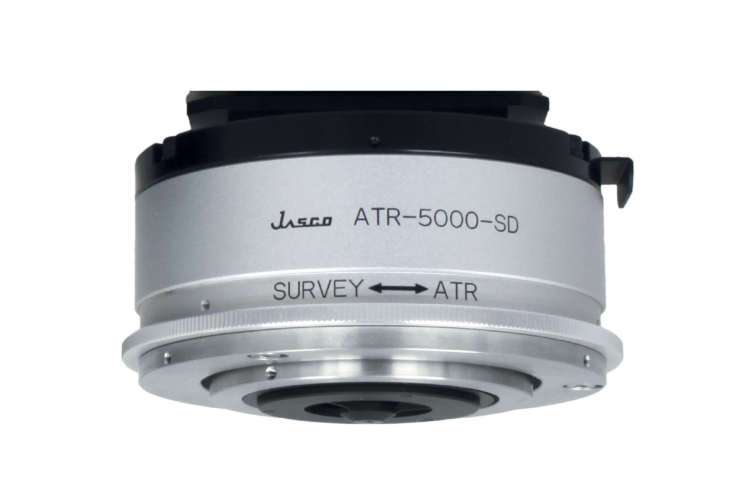
- Variety of measurement modes (Transmission, Reflection, ATR, Grazing Angle Reflection)
- Multiple objective capabilities with a 4-position objective carousel
- Field upgrade to high-speed IR Imaging System using a 16-element linear array detector
IRT-7000 Series FTIR Microscopes
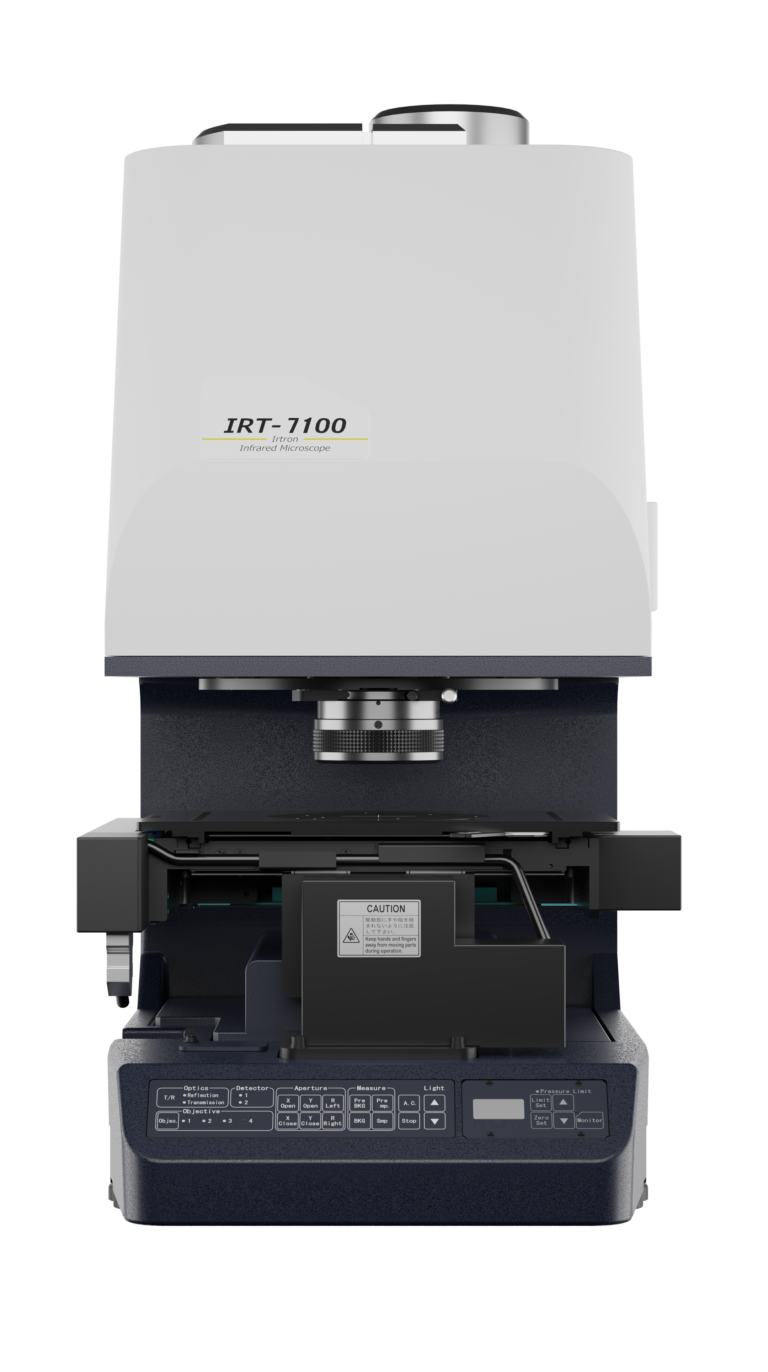
IRT-7100 High Sensitivity Imaging FTIR Microscope (optional upgrade to Linear Array Detector
The IRT-7100 fully automated FTIR microscope includes a single-point mid-band MCT detector, with the option to install an additional internal detector. It can be easily field-upgradable to a linear array imaging system by adding an optional 16-channel MCT detector. The automatic sample stage and IQ Mapping provides wide area mapping and multi-ATR mapping.
- Fully automated sample stage with autofocus
- IQ Mapping
- Multiple objectives with a 4-position motorized objective carousel
- Dual detector ready (optional second detector or user-swappable detectors)
- Field upgrade to high-speed IR Imaging System using a 16-element linear array detector
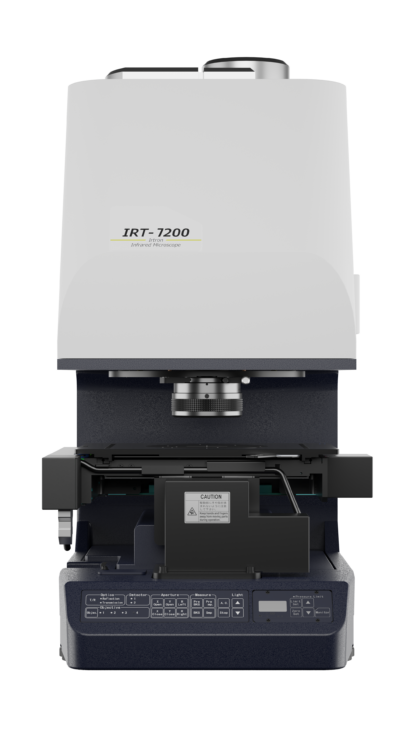
IRT-7200 Linear Array Imaging FTIR Microscope
The IRT-7200 Linear Array FTIR Imaging microscope includes two detectors as standard: a 16-channel linear array detector and a single-point mid-band MCT detector. The combination of the standard automatic sample stage and “IQ Mapping” function allows mapping analyses of a larger sample area, multi-area ATR mapping, and IR imaging of a specified area with extremely high spatial resolution and excellent sensitivity in a short time.
- Full high-speed IR Imaging function using a 16-element linear array detector
- IQ Mapping
- Multiple objective capabilities with a 4-position objective carousel
- Wide area mapping and multi-ATR imaging
- Dynamic Imaging with FTIR step-scan option
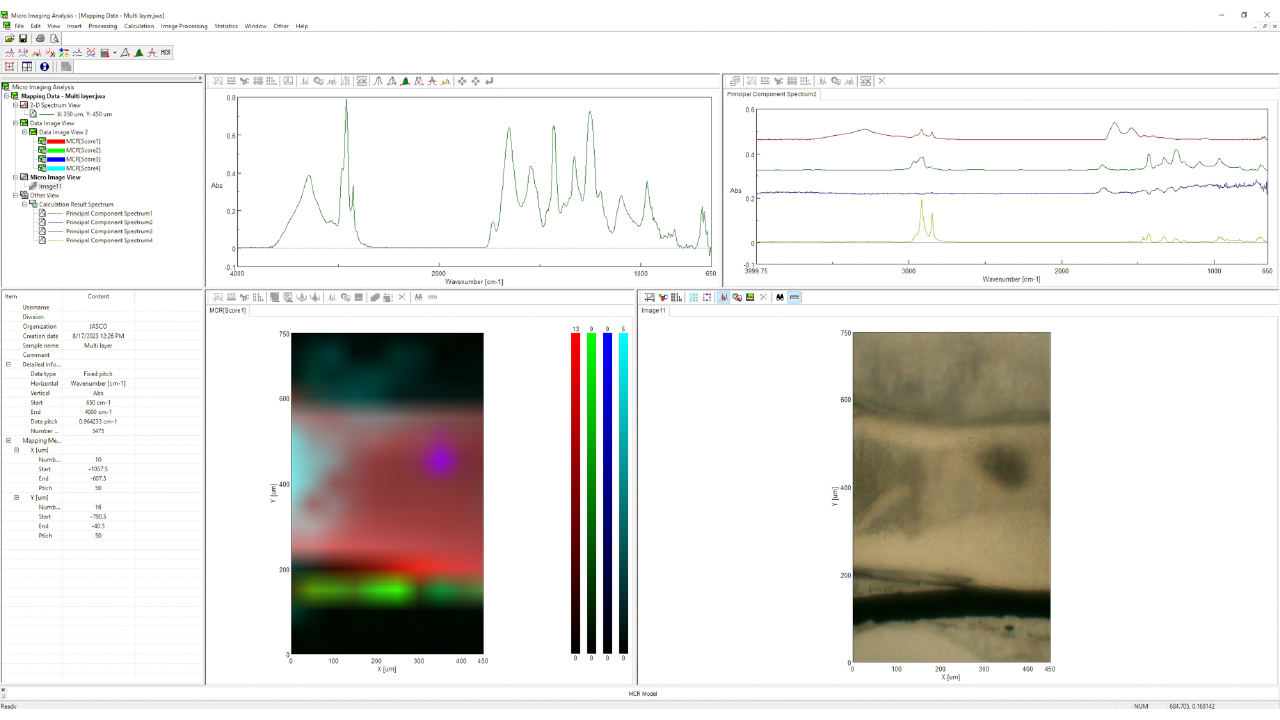
- Multivariate analysis Principal Component Analysis (PCA) as standard

System Features
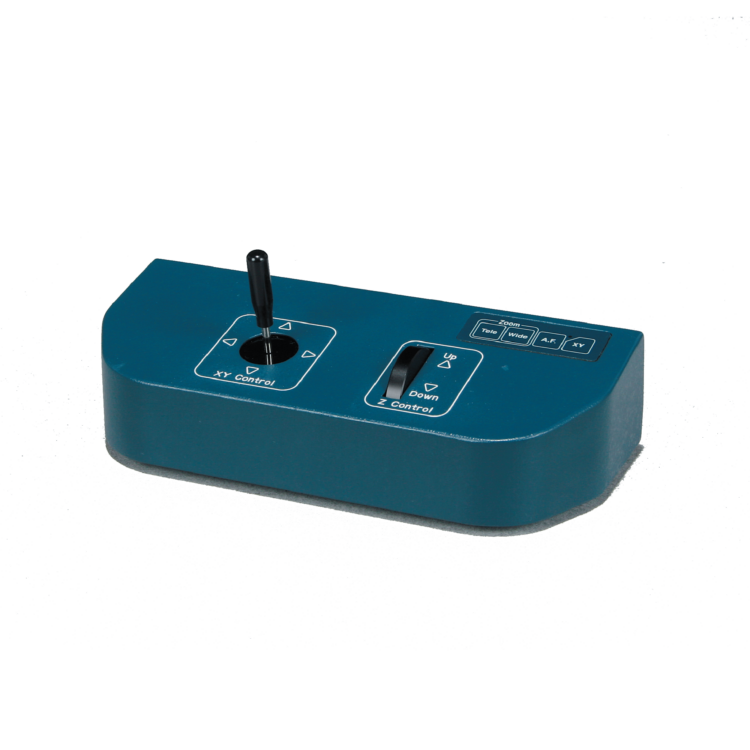
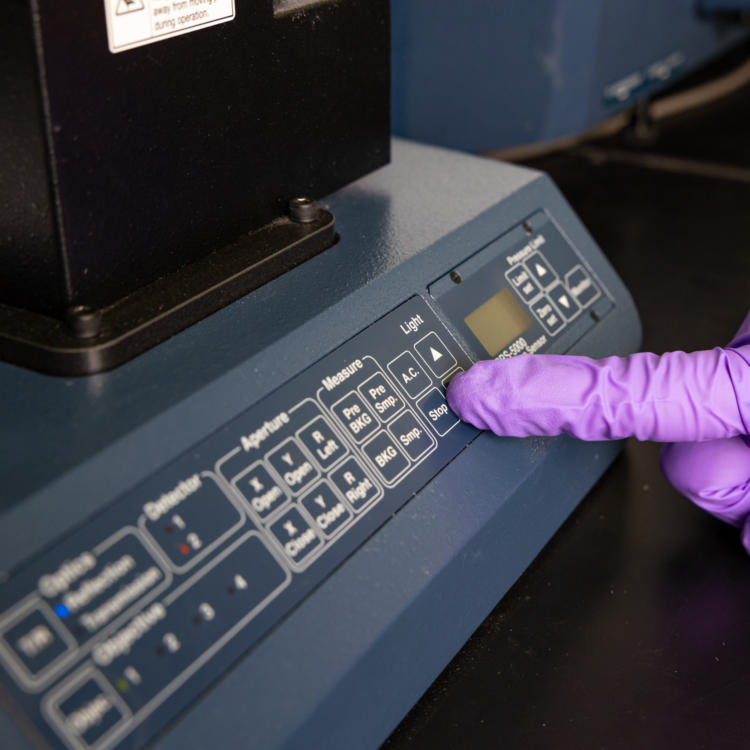
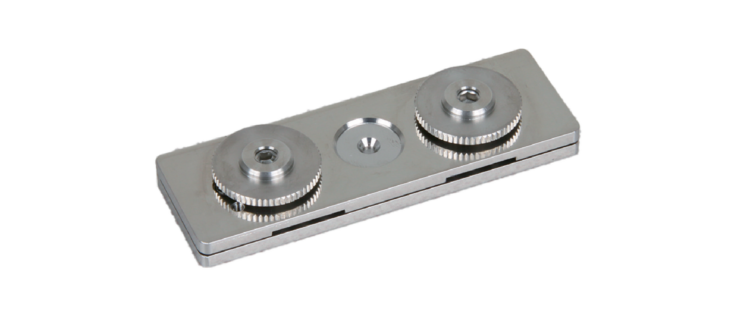
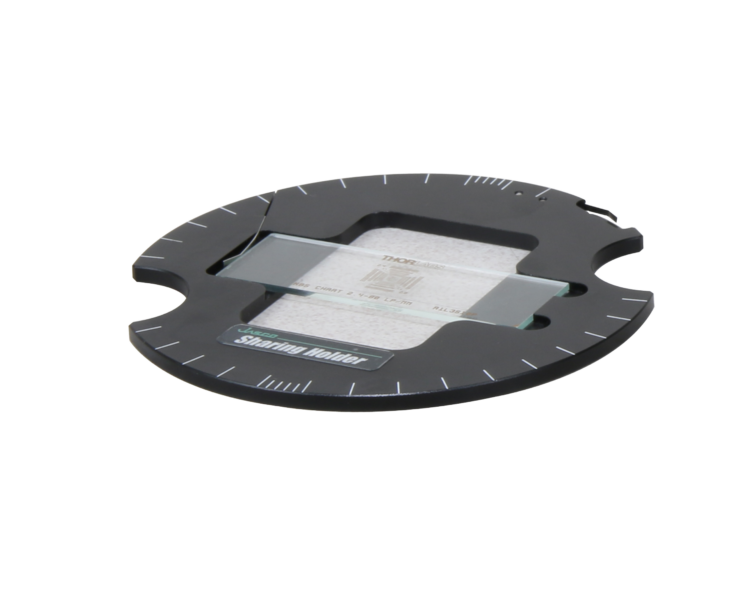
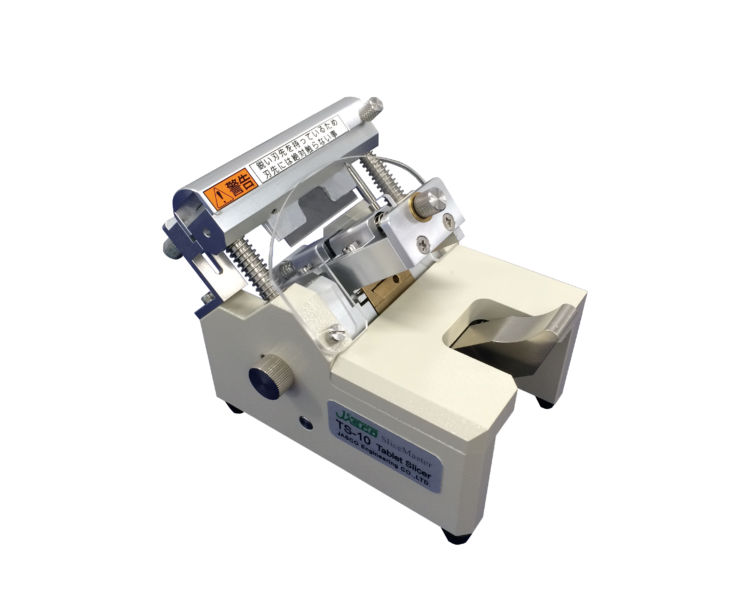
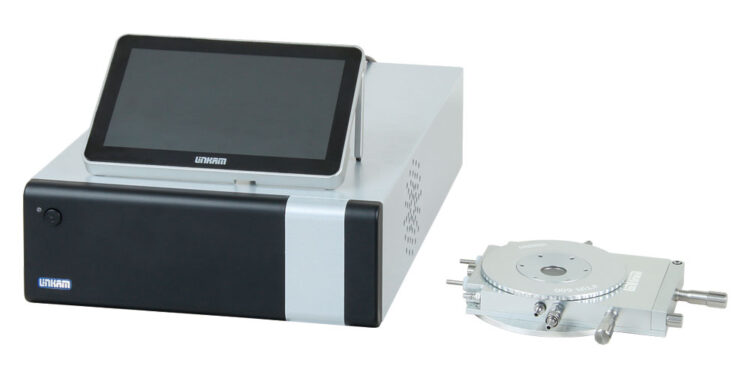
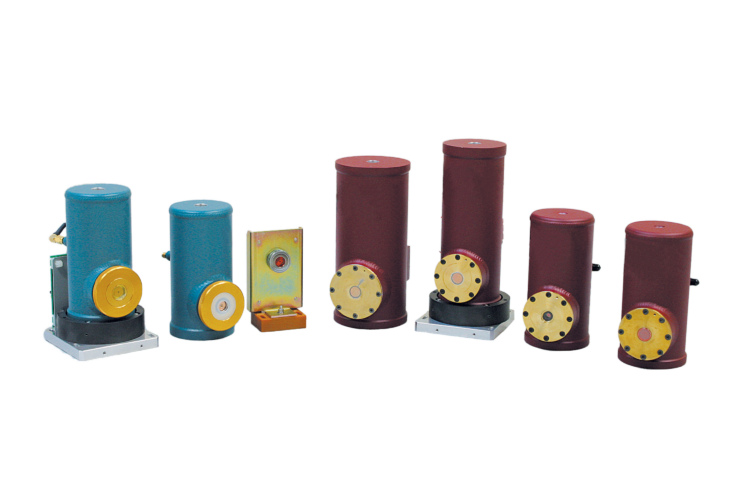
Components
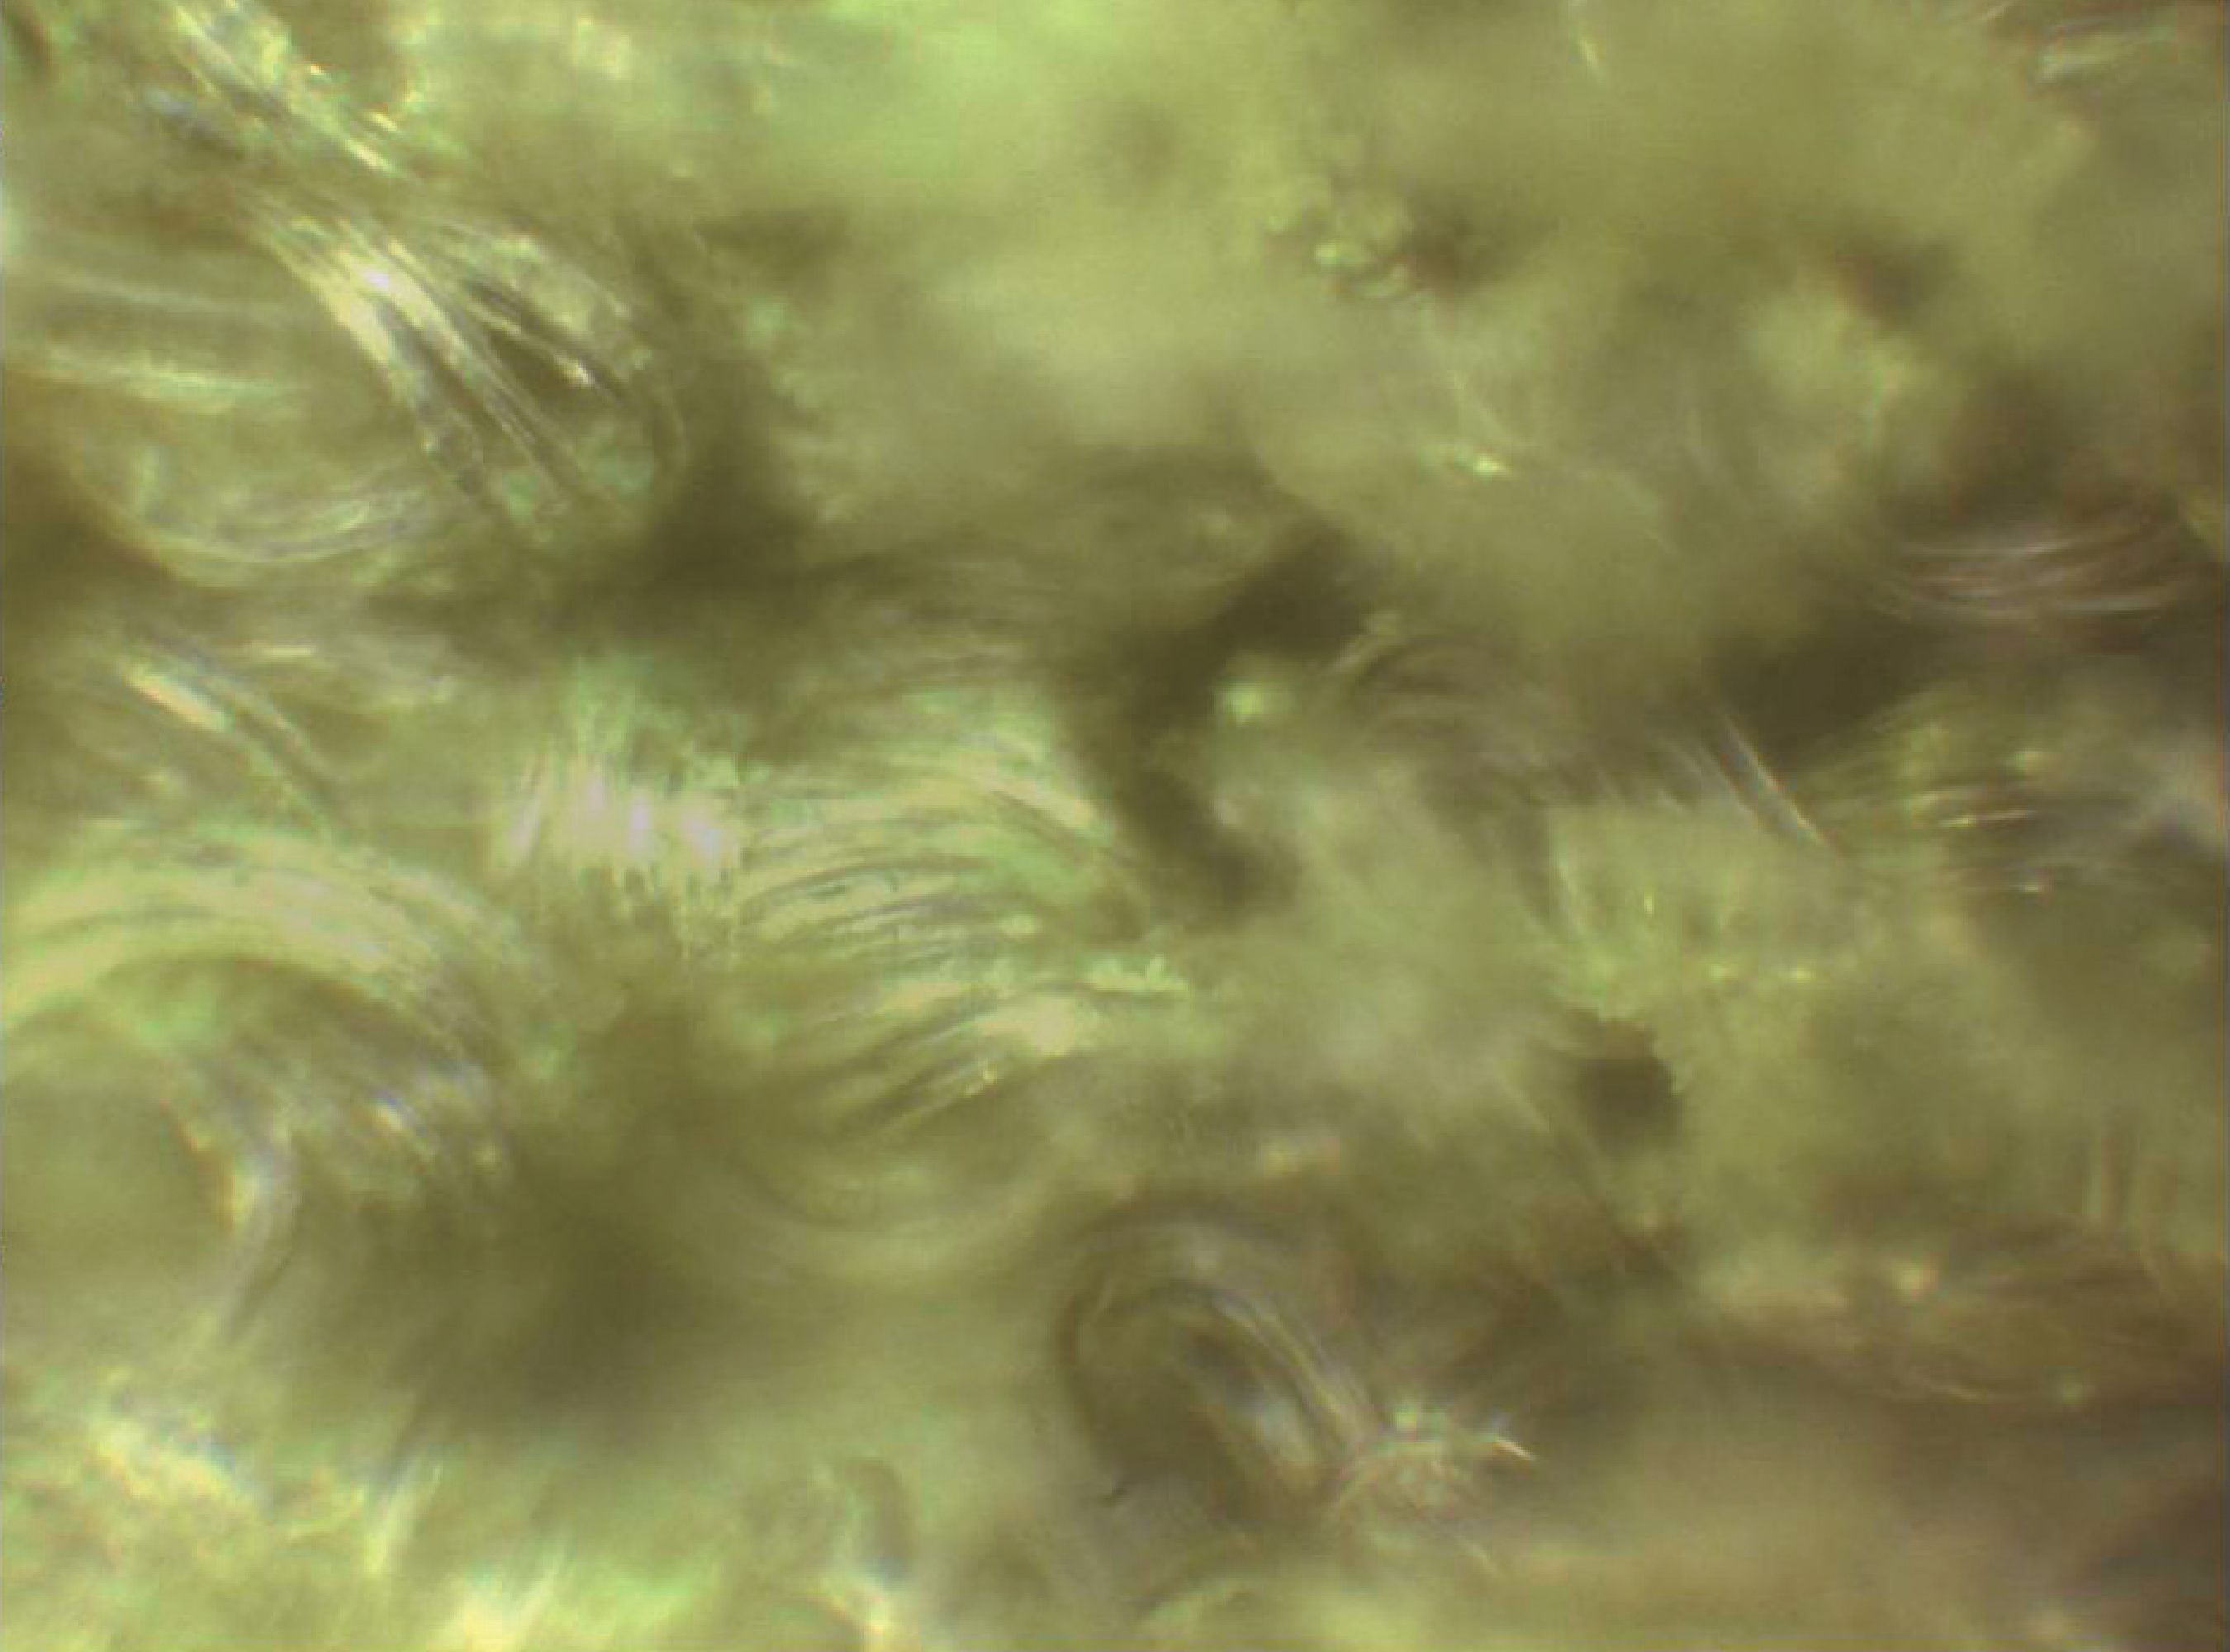
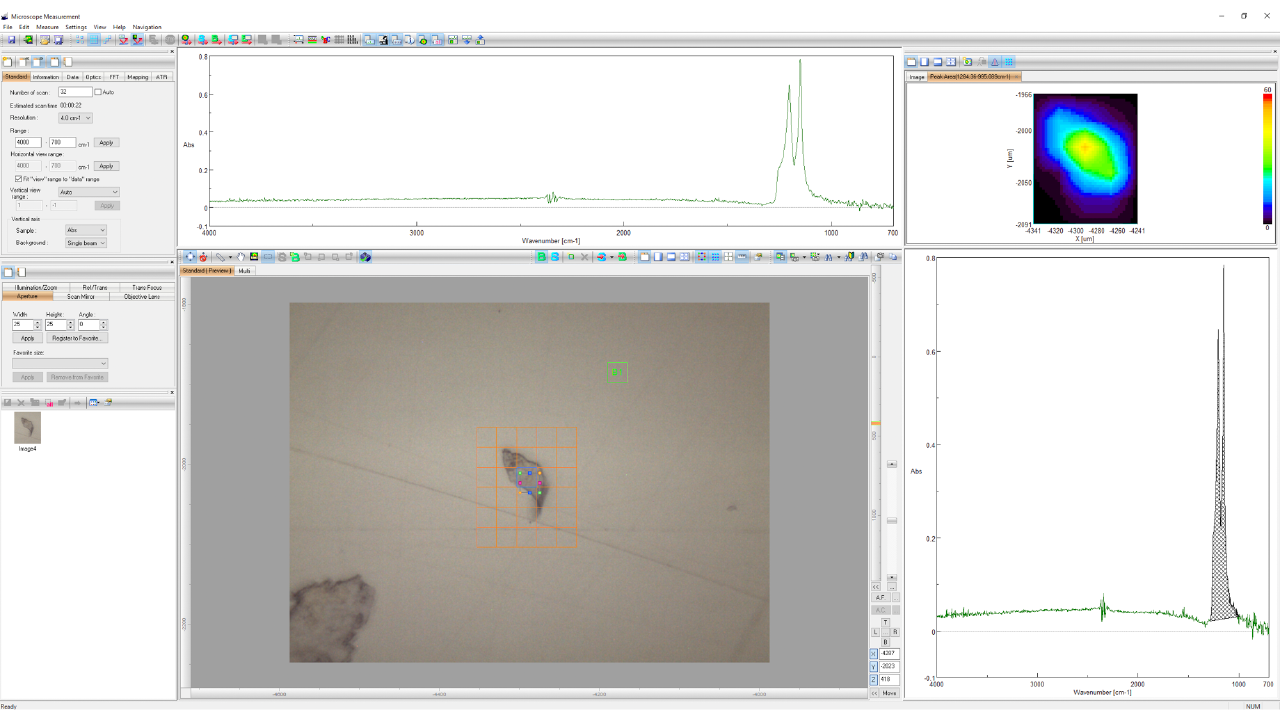
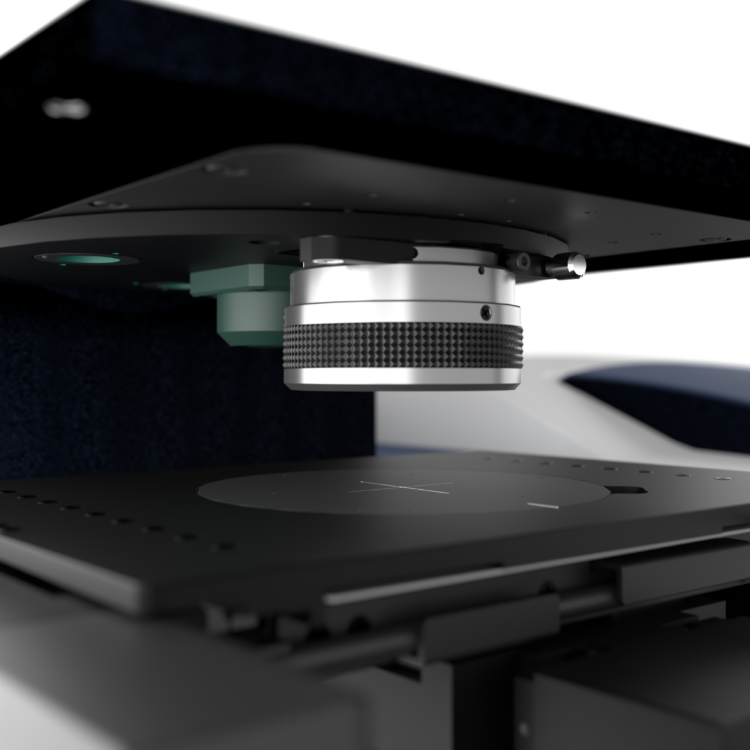
Observation View (before contact)
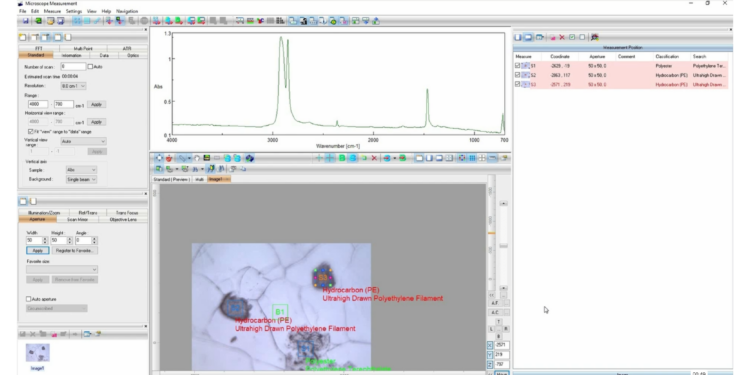
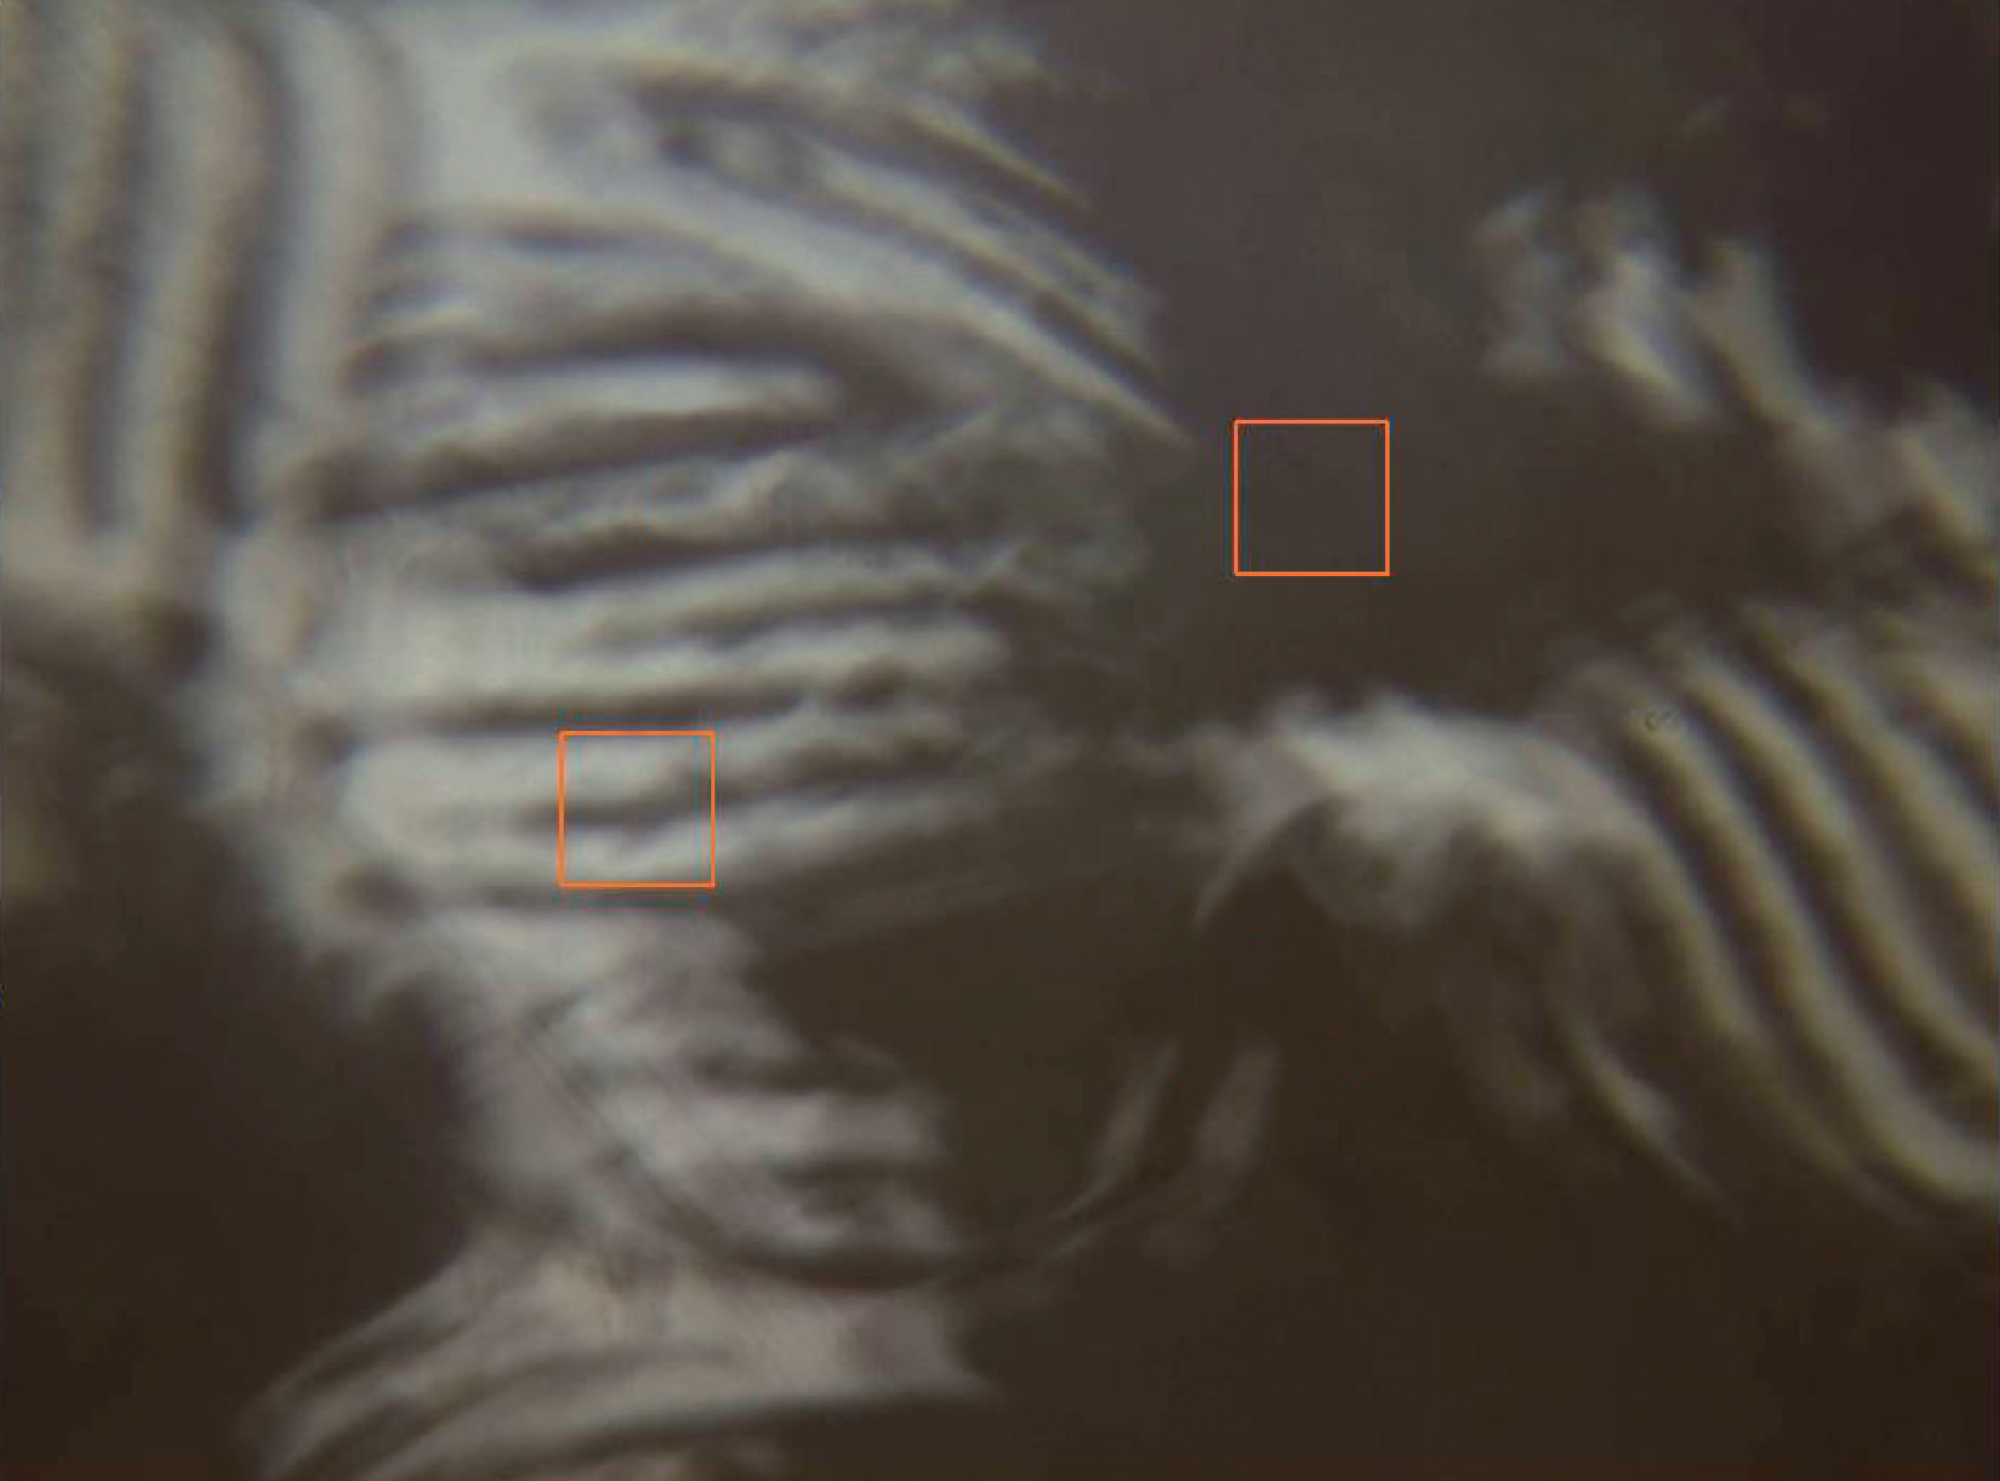
View of the Measurement Position (after contact)
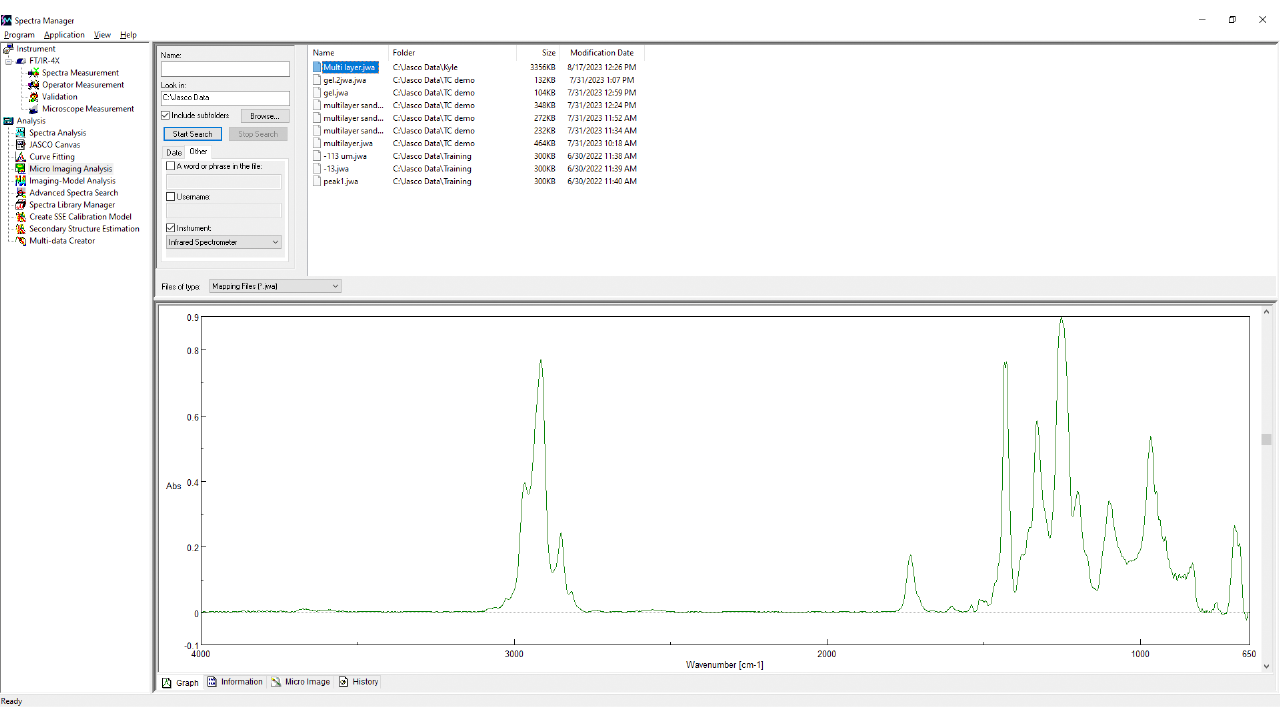
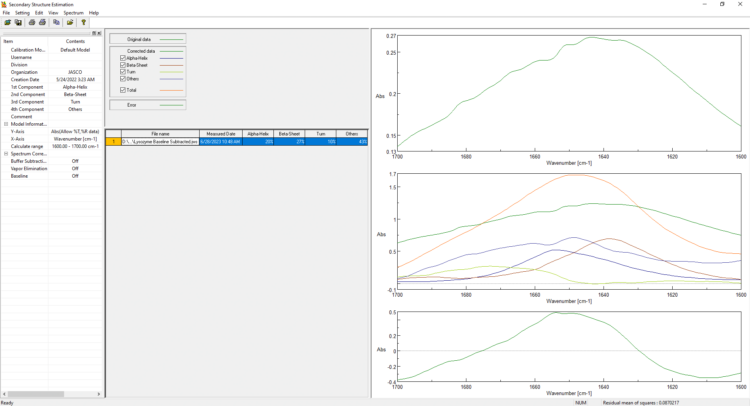
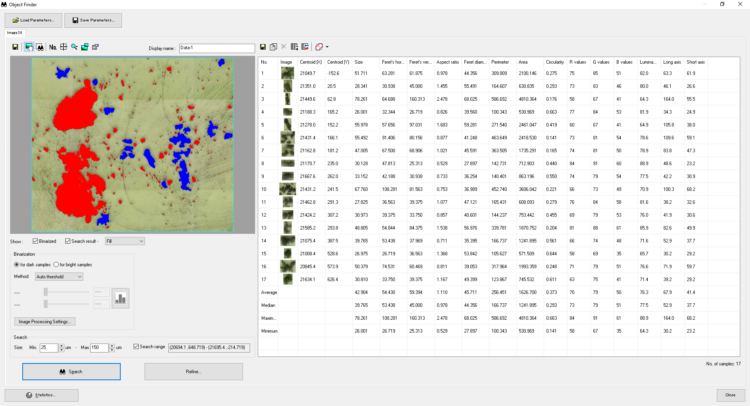
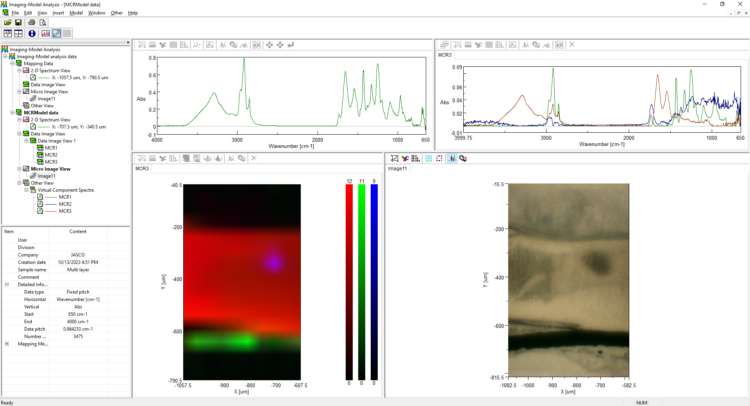
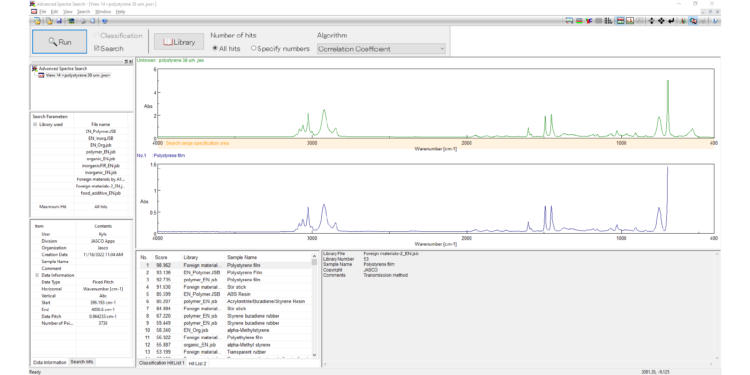
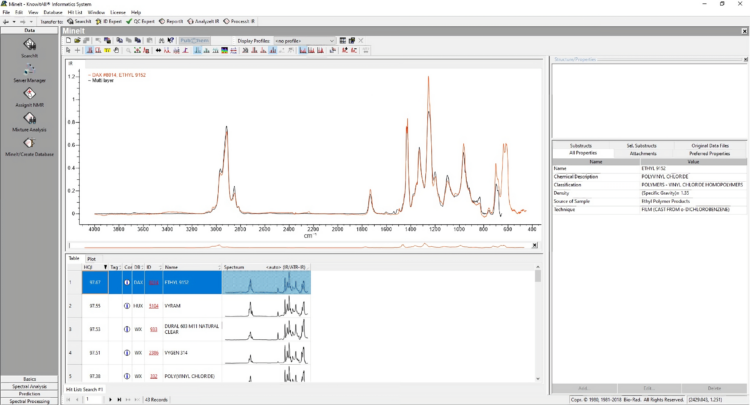
Software