FTIR Microscopes IRT-5000/7000 Series

For Imaging & Analysis

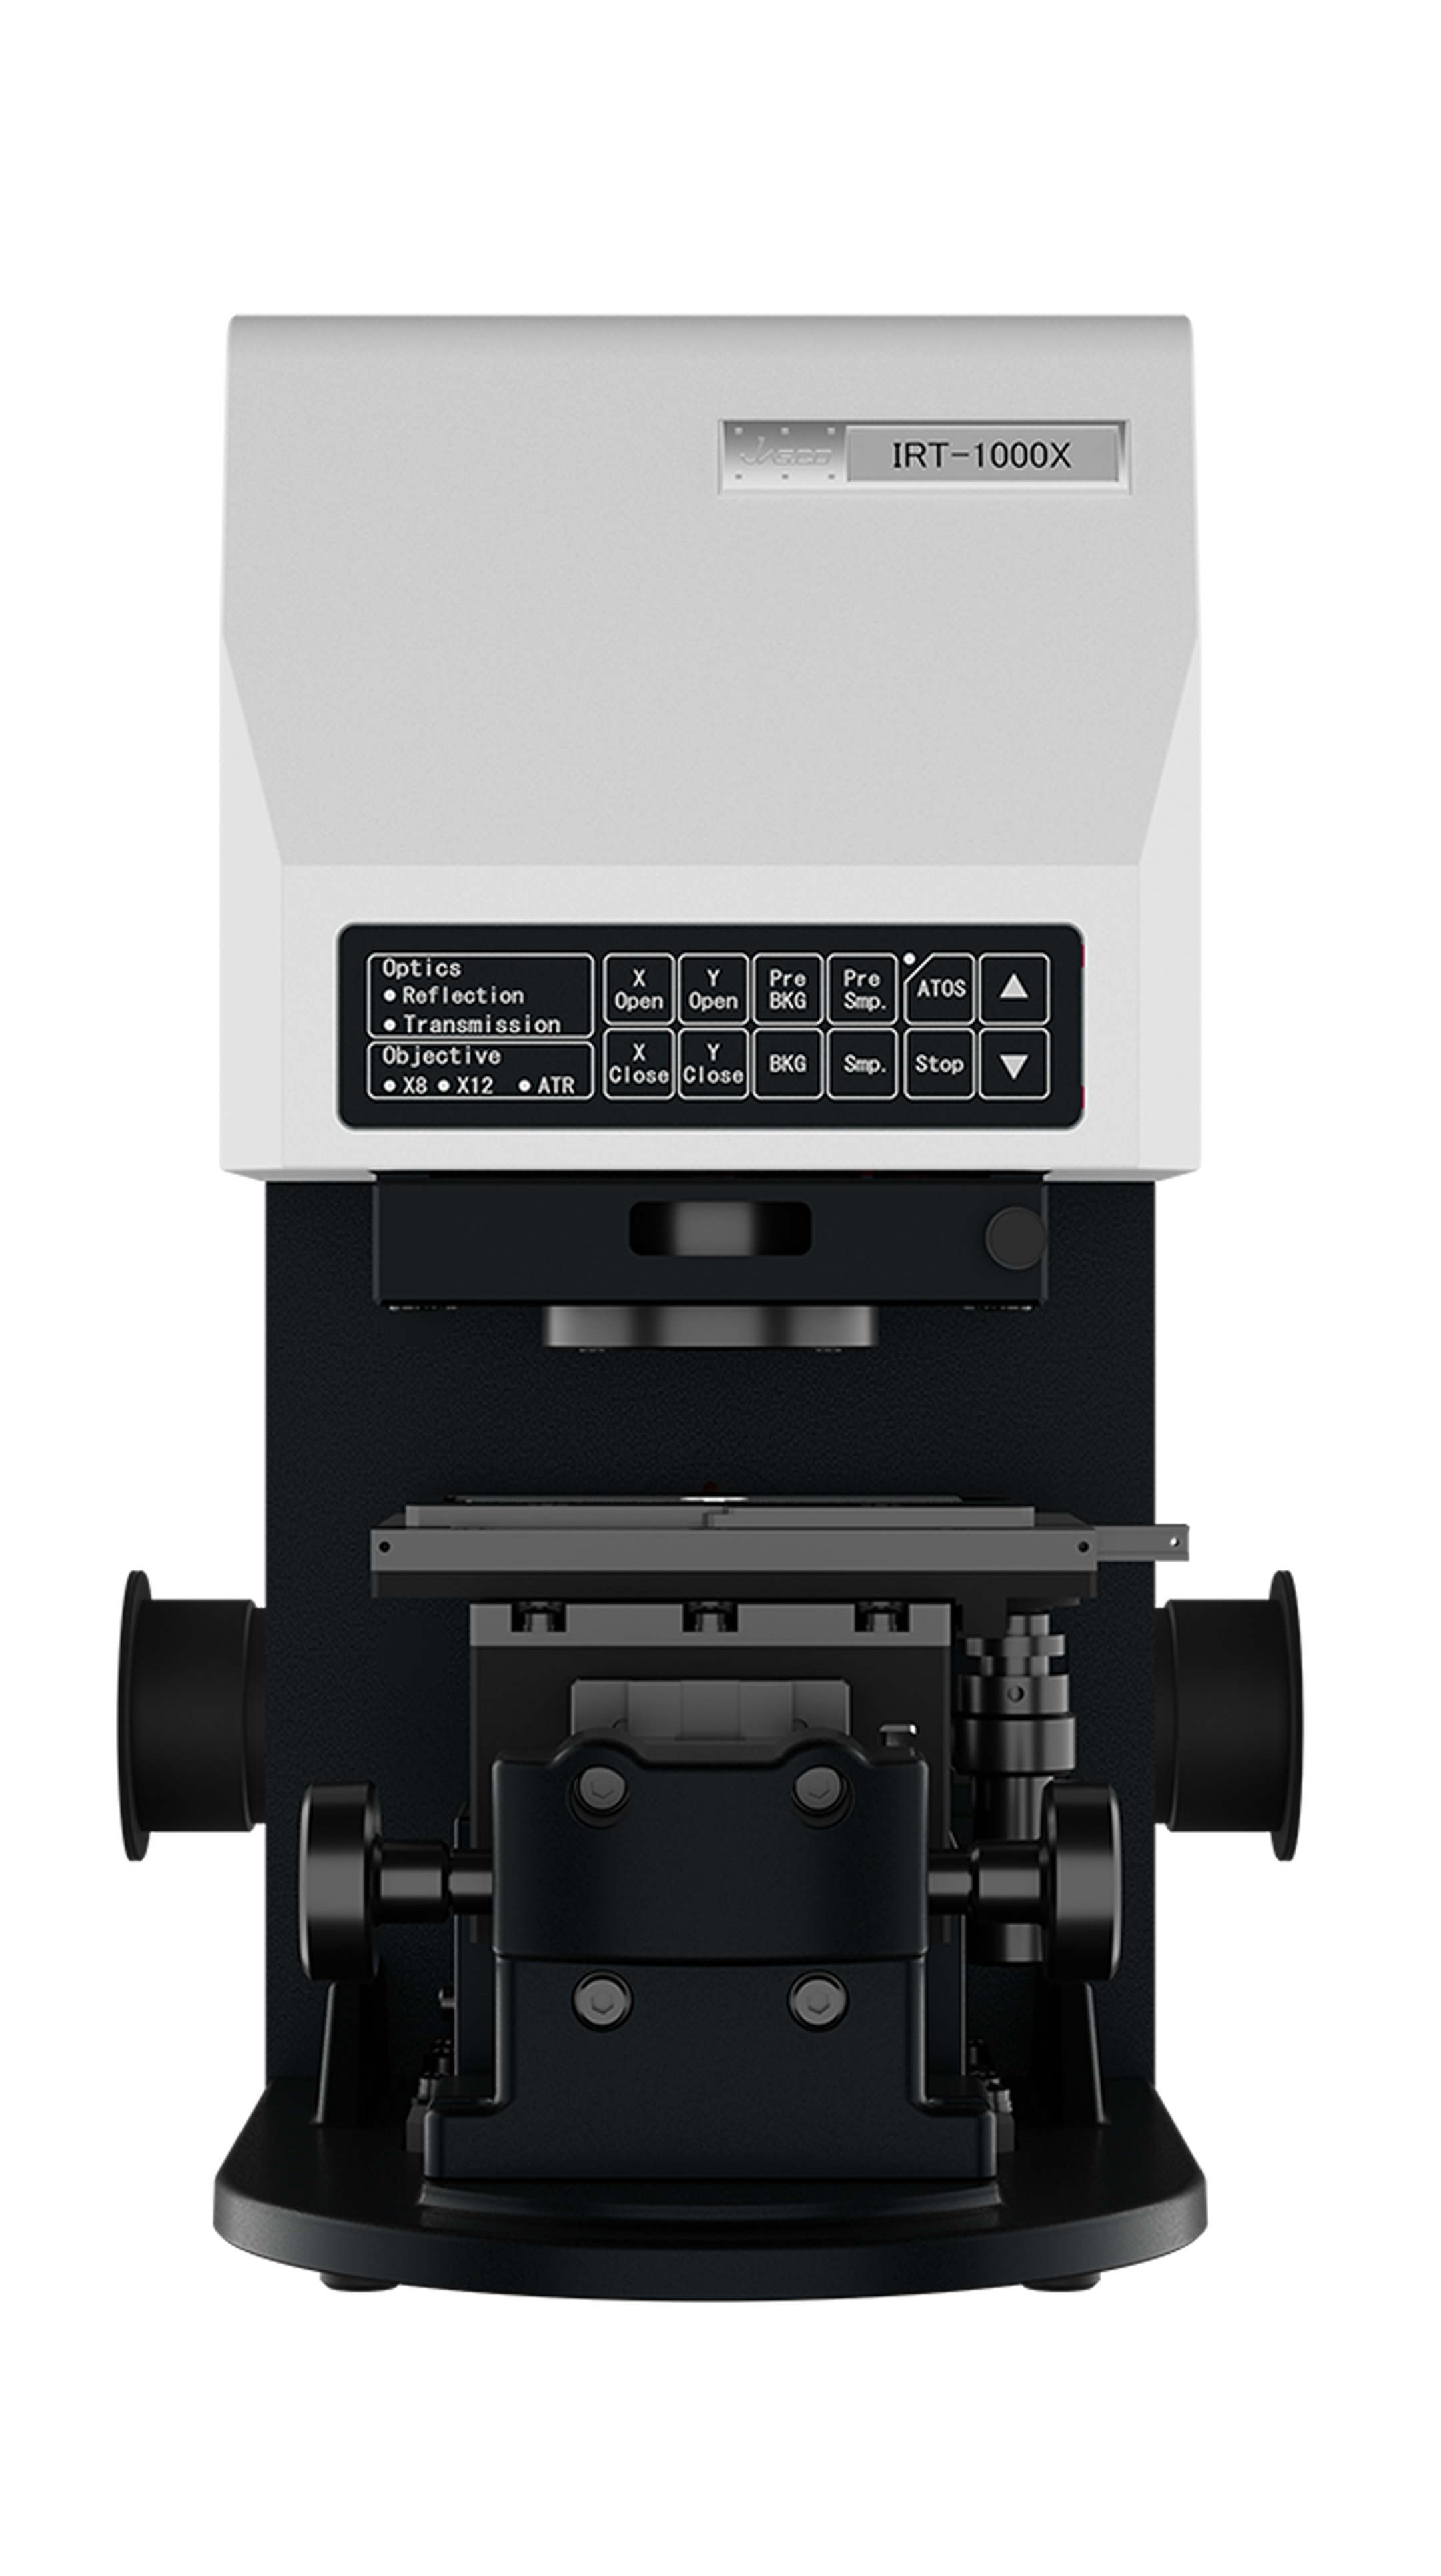
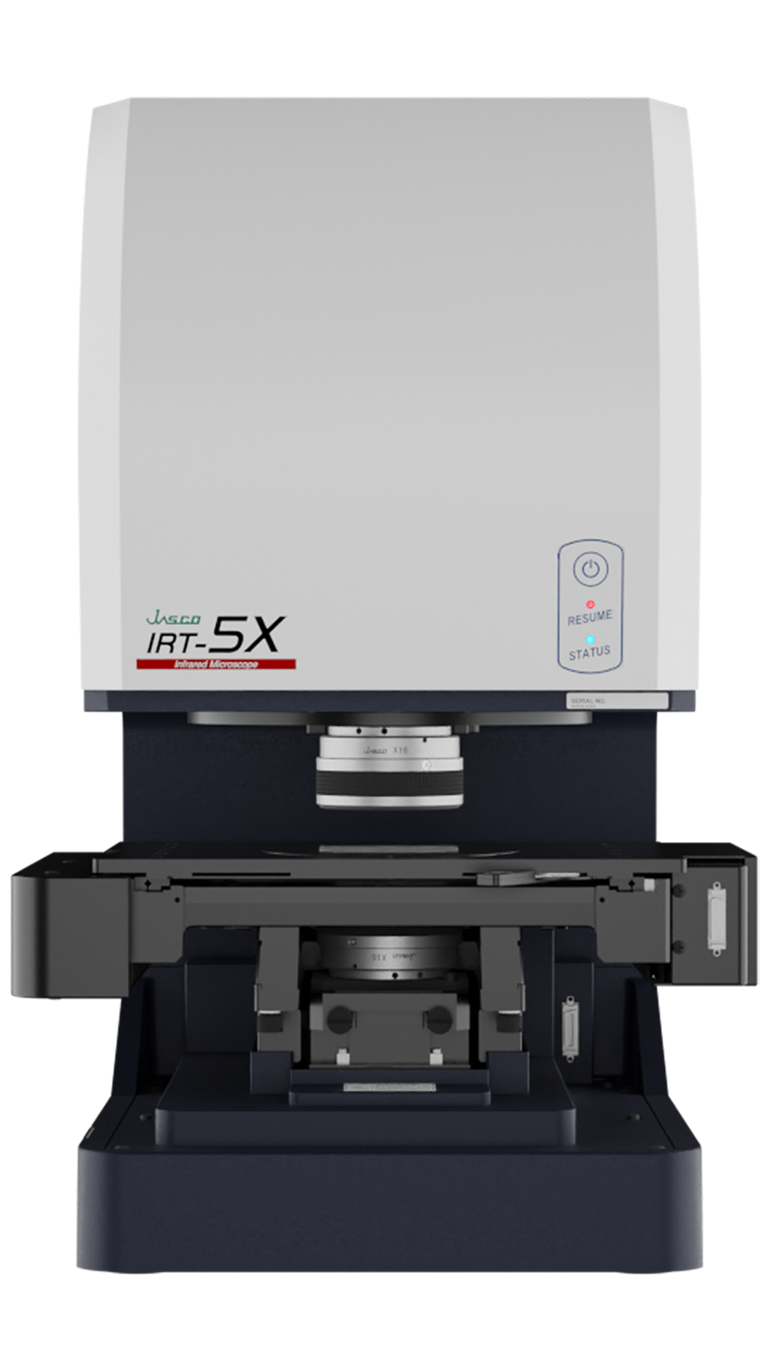
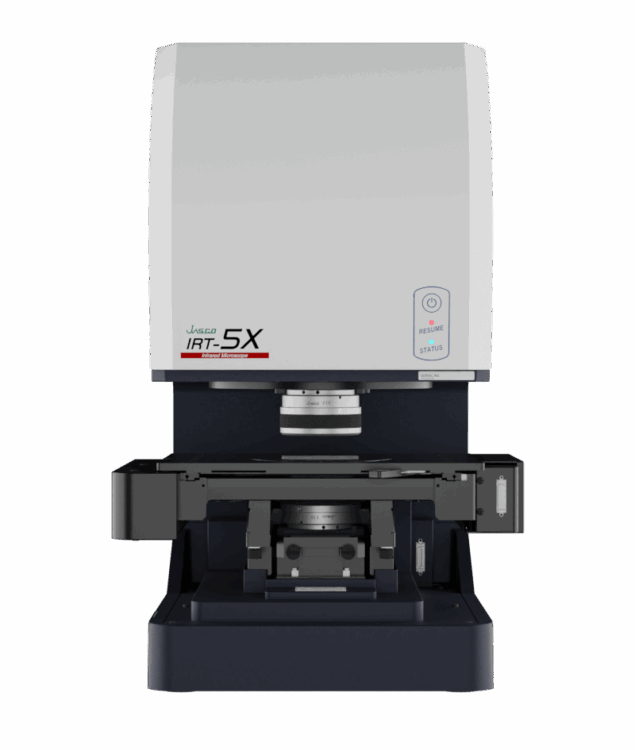
  • IRT-5200

    With mid-band MCT detector and. IQ Mapping for single-point, multi-point, line, area, and ATR mapping measurement without moving the sample stage. XYZ stage provides auto-focus and mapping or imaging analysis of larger sample areas.

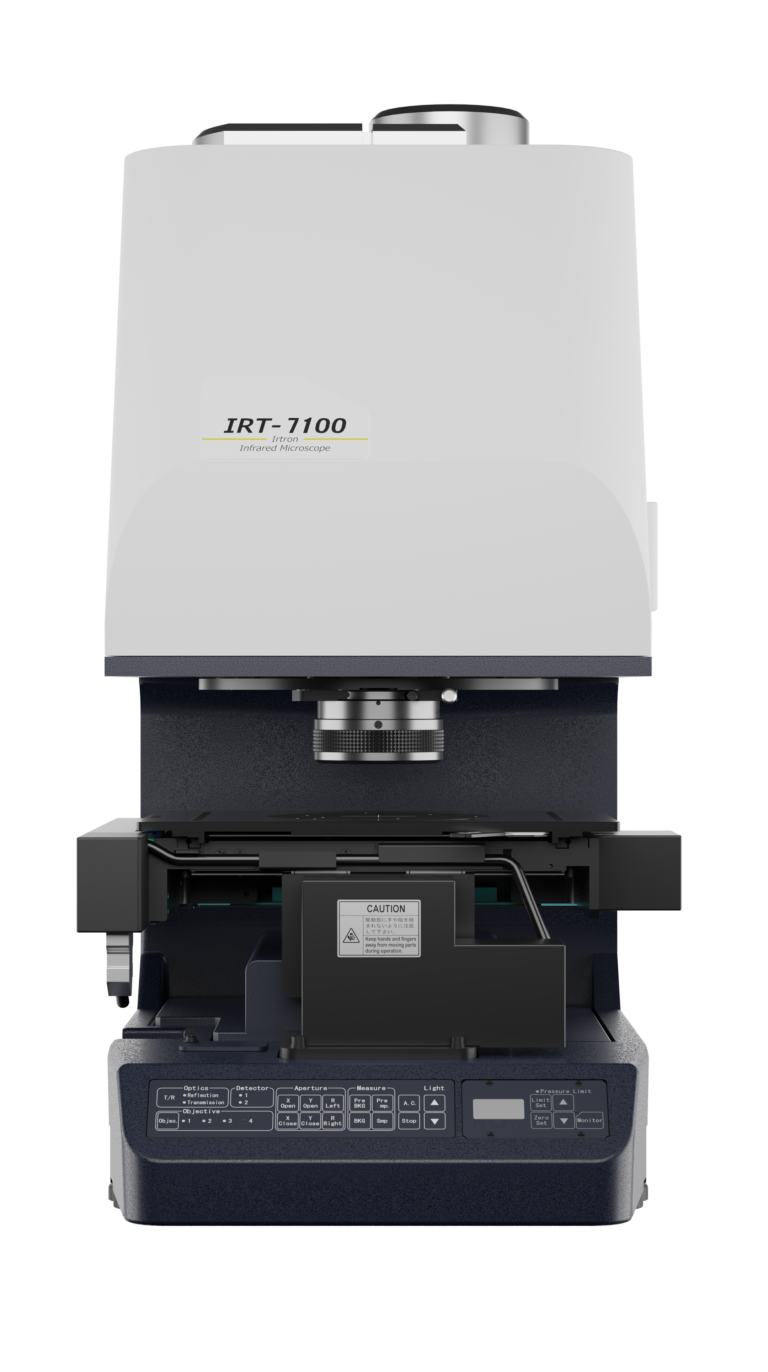
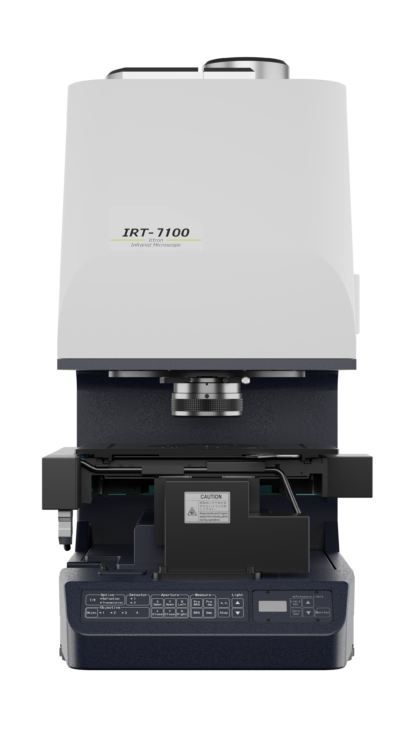
  • IRT-7100

    Fully automated FTIR microscope with single-point mid-band MCT detector, field-upgradable to an IR imaging system by adding an optional 16-channel linear array detector. The standard automatic sample stage and “IQ Mapping” function provides wide area mapping and multi-ATR mapping.

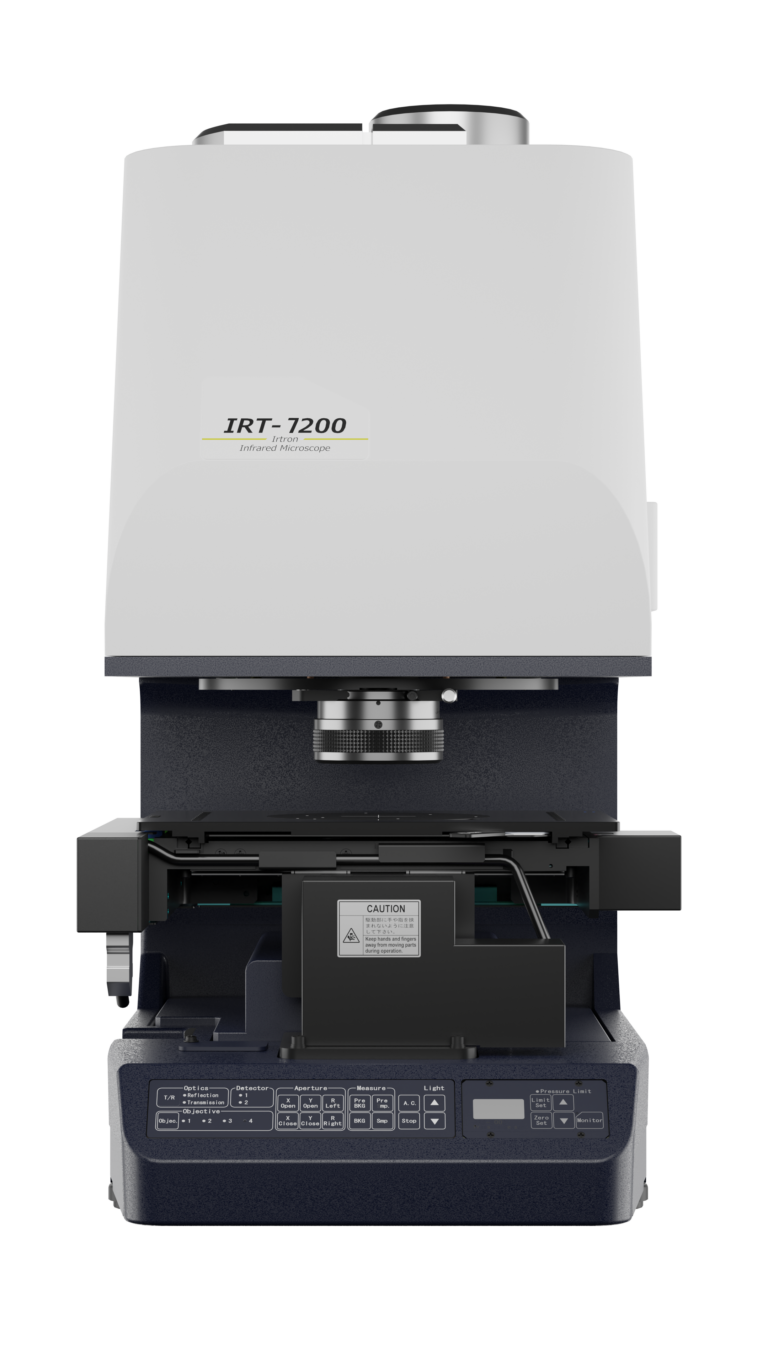
  • IRT-7200

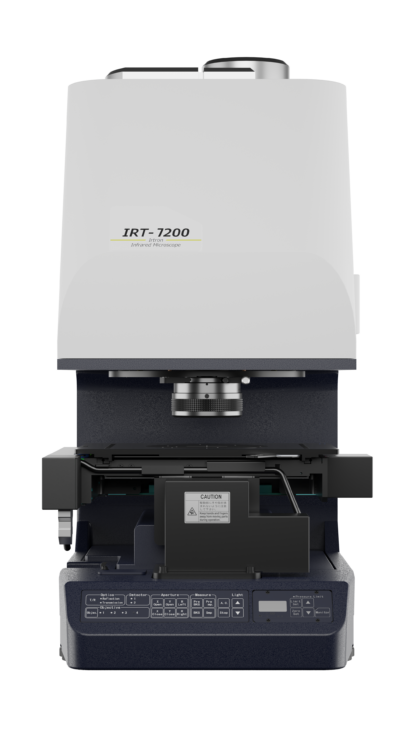
    Linear Array FTIR imaging microscope with 16-channel linear array detector and single-point mid-band MCT detector. The combination of the standard automatic sample stage and IQ Mapping” allows mapping larger sample areas, multi-area ATR mapping, and IR imaging of a specified area with extremely high spatial resolution and excellent sensitivity in a short time.

IRT-5000 Series FTIR Microscopes

IRT-5200 FTIR Microscope

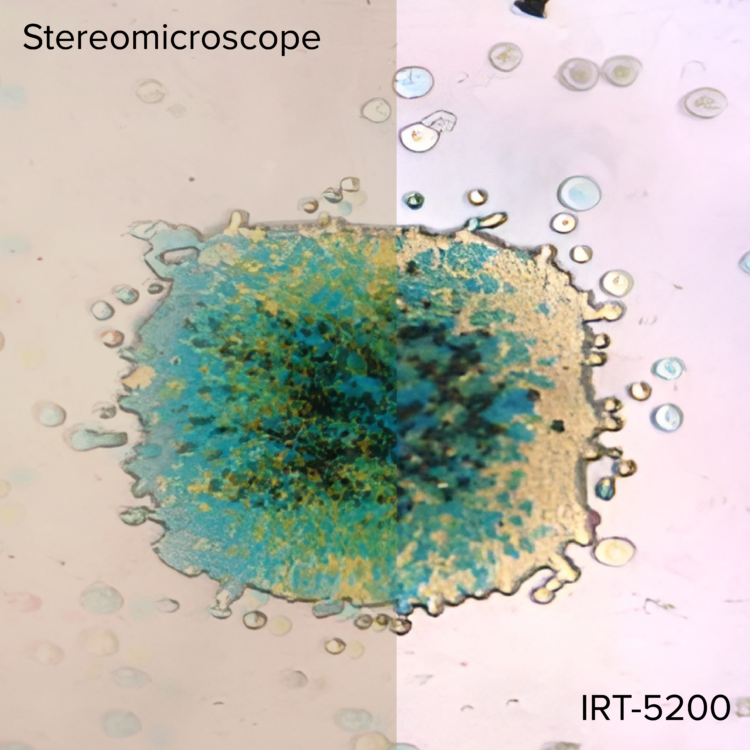
Includes a high-sensitivity mid-band MCT detector, a second detector can be added as option. IQ Mapping allows single-point, multi-point, line, area, and ATR mapping measurement without moving the sample stage. An optional automatic XYZ stage provides auto-focus and mapping or imaging analysis of larger sample areas.

  • IQ Mapping
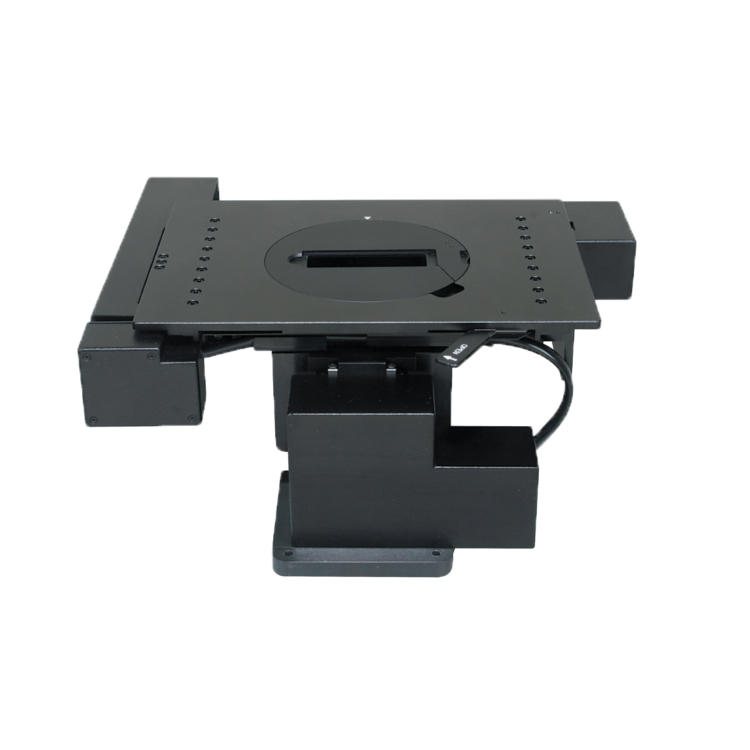
  • Optional automatic XYZ sample stage
  • Optional dual detector, with user-exchangeable detectors using a ‘cassette’ system
  • Variety of measurement modes (Transmission, Reflection, ATR, Grazing Angle Reflection)
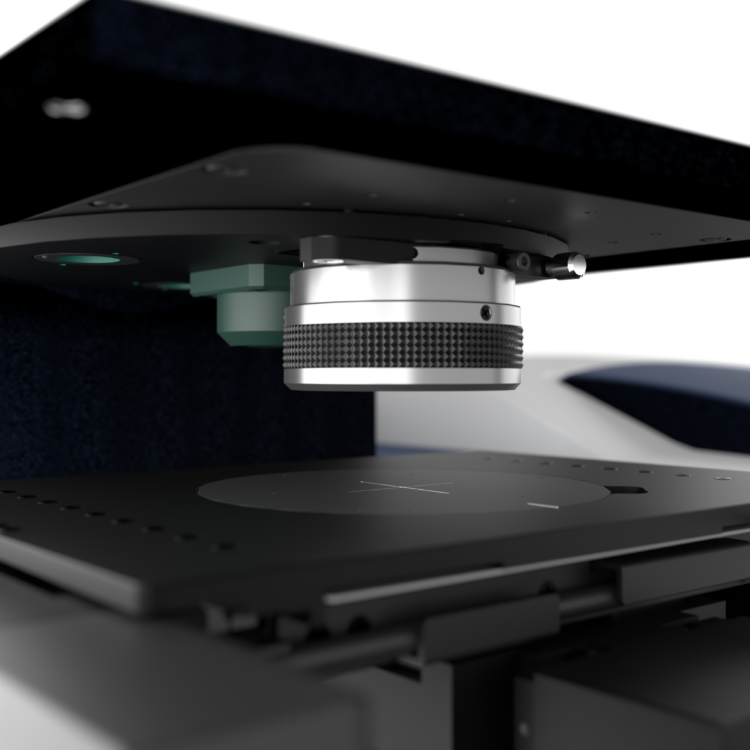
  • Multiple objective capabilities with a 4-position objective carousel
  • Field upgrade to high-speed IR Imaging System using a 16-element linear array detector

IRT-7000 Series FTIR Microscopes

IRT-7100 High Sensitivity Imaging FTIR Microscope (optional upgrade to Linear Array Detector

The IRT-7100 fully automated FTIR microscope includes a single-point mid-band MCT detector, with the option to install an additional internal detector. It can be easily field-upgradable to a linear array imaging system by adding an optional 16-channel MCT detector. The automatic sample stage and IQ Mapping provides wide area mapping and multi-ATR mapping.

  • Fully automated sample stage with autofocus
  • IQ Mapping
  • Multiple objectives with a 4-position motorized objective carousel
  • Dual detector ready (optional second detector or user-swappable detectors)
  • Field upgrade to high-speed IR Imaging System using a 16-element linear array detector

IRT-7200 Linear Array Imaging FTIR Microscope

The IRT-7200 Linear Array FTIR Imaging microscope includes two detectors as standard: a 16-channel linear array detector and a single-point mid-band MCT detector. The combination of the standard automatic sample stage and “IQ Mapping” function allows mapping analyses of a larger sample area, multi-area ATR mapping, and IR imaging of a specified area with extremely high spatial resolution and excellent sensitivity in a short time.

  • Full high-speed IR Imaging function using a 16-element linear array detector
  • IQ Mapping
  • Multiple objective capabilities with a 4-position objective carousel
  • Wide area mapping and multi-ATR imaging
  • Dynamic Imaging with FTIR step-scan option
  • Multivariate analysis Principal Component Analysis (PCA) as standard

Components

  • Detectors

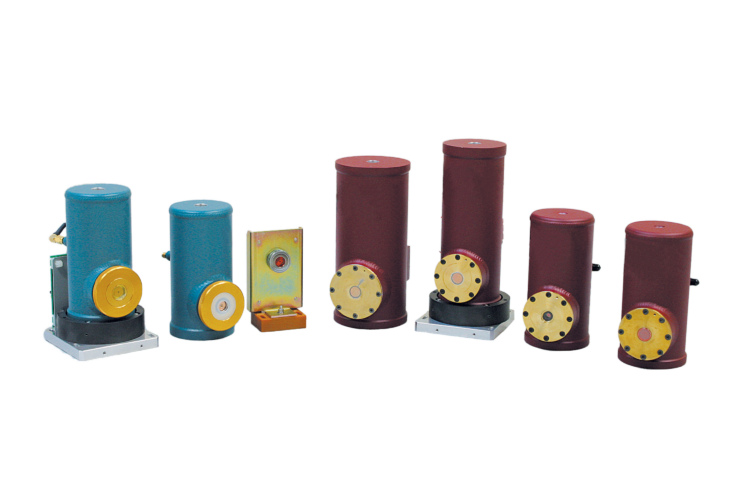
    The optional detectors cover the wavelength range from the visible (silicon photodiode, InSb or InGaAs) to mid-IR (narrow, mid and wide band MCT), to far-IR.

  • Objectives

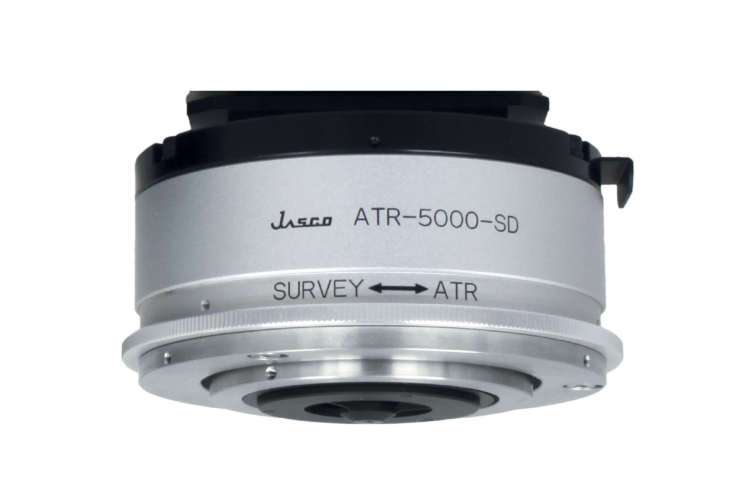
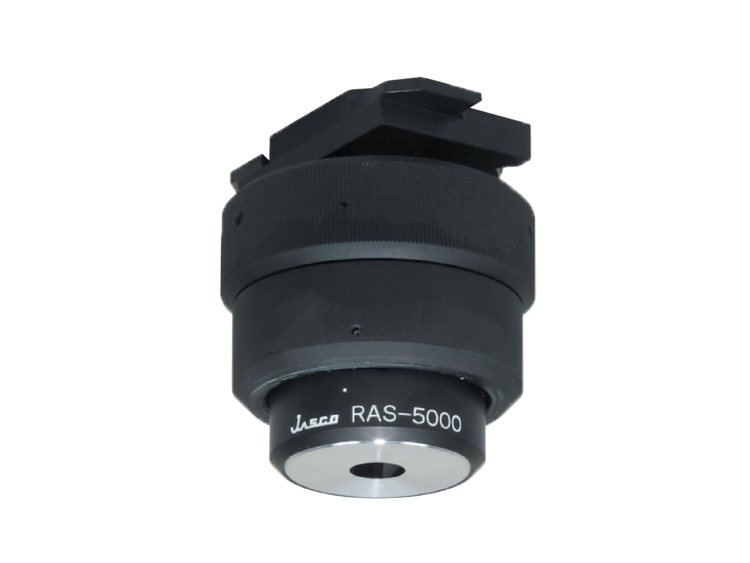
    There are a variety of different optional objectives available, including Cassegrain objectives (aluminum and gold), refractive objectives (4x, 10x, 20x), and ATR objectives (conventional, projection, wide-area, and ClearViewTM).

  • Observation Modes

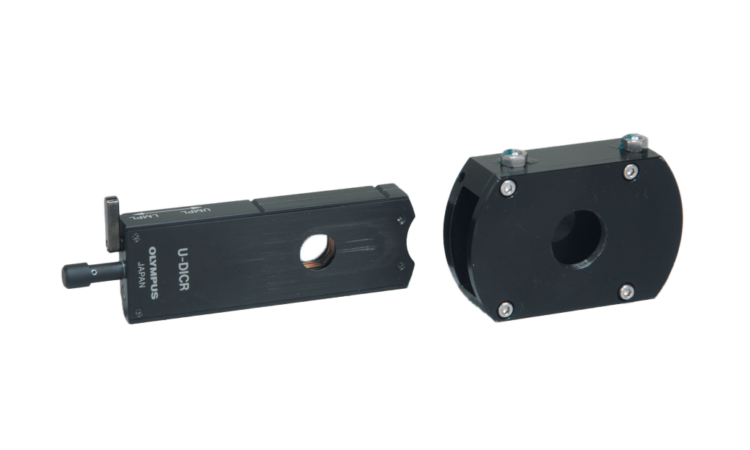
    The IRT microscope has a variety of different observation modes used to identify and observe samples.

ClearView™ ATR

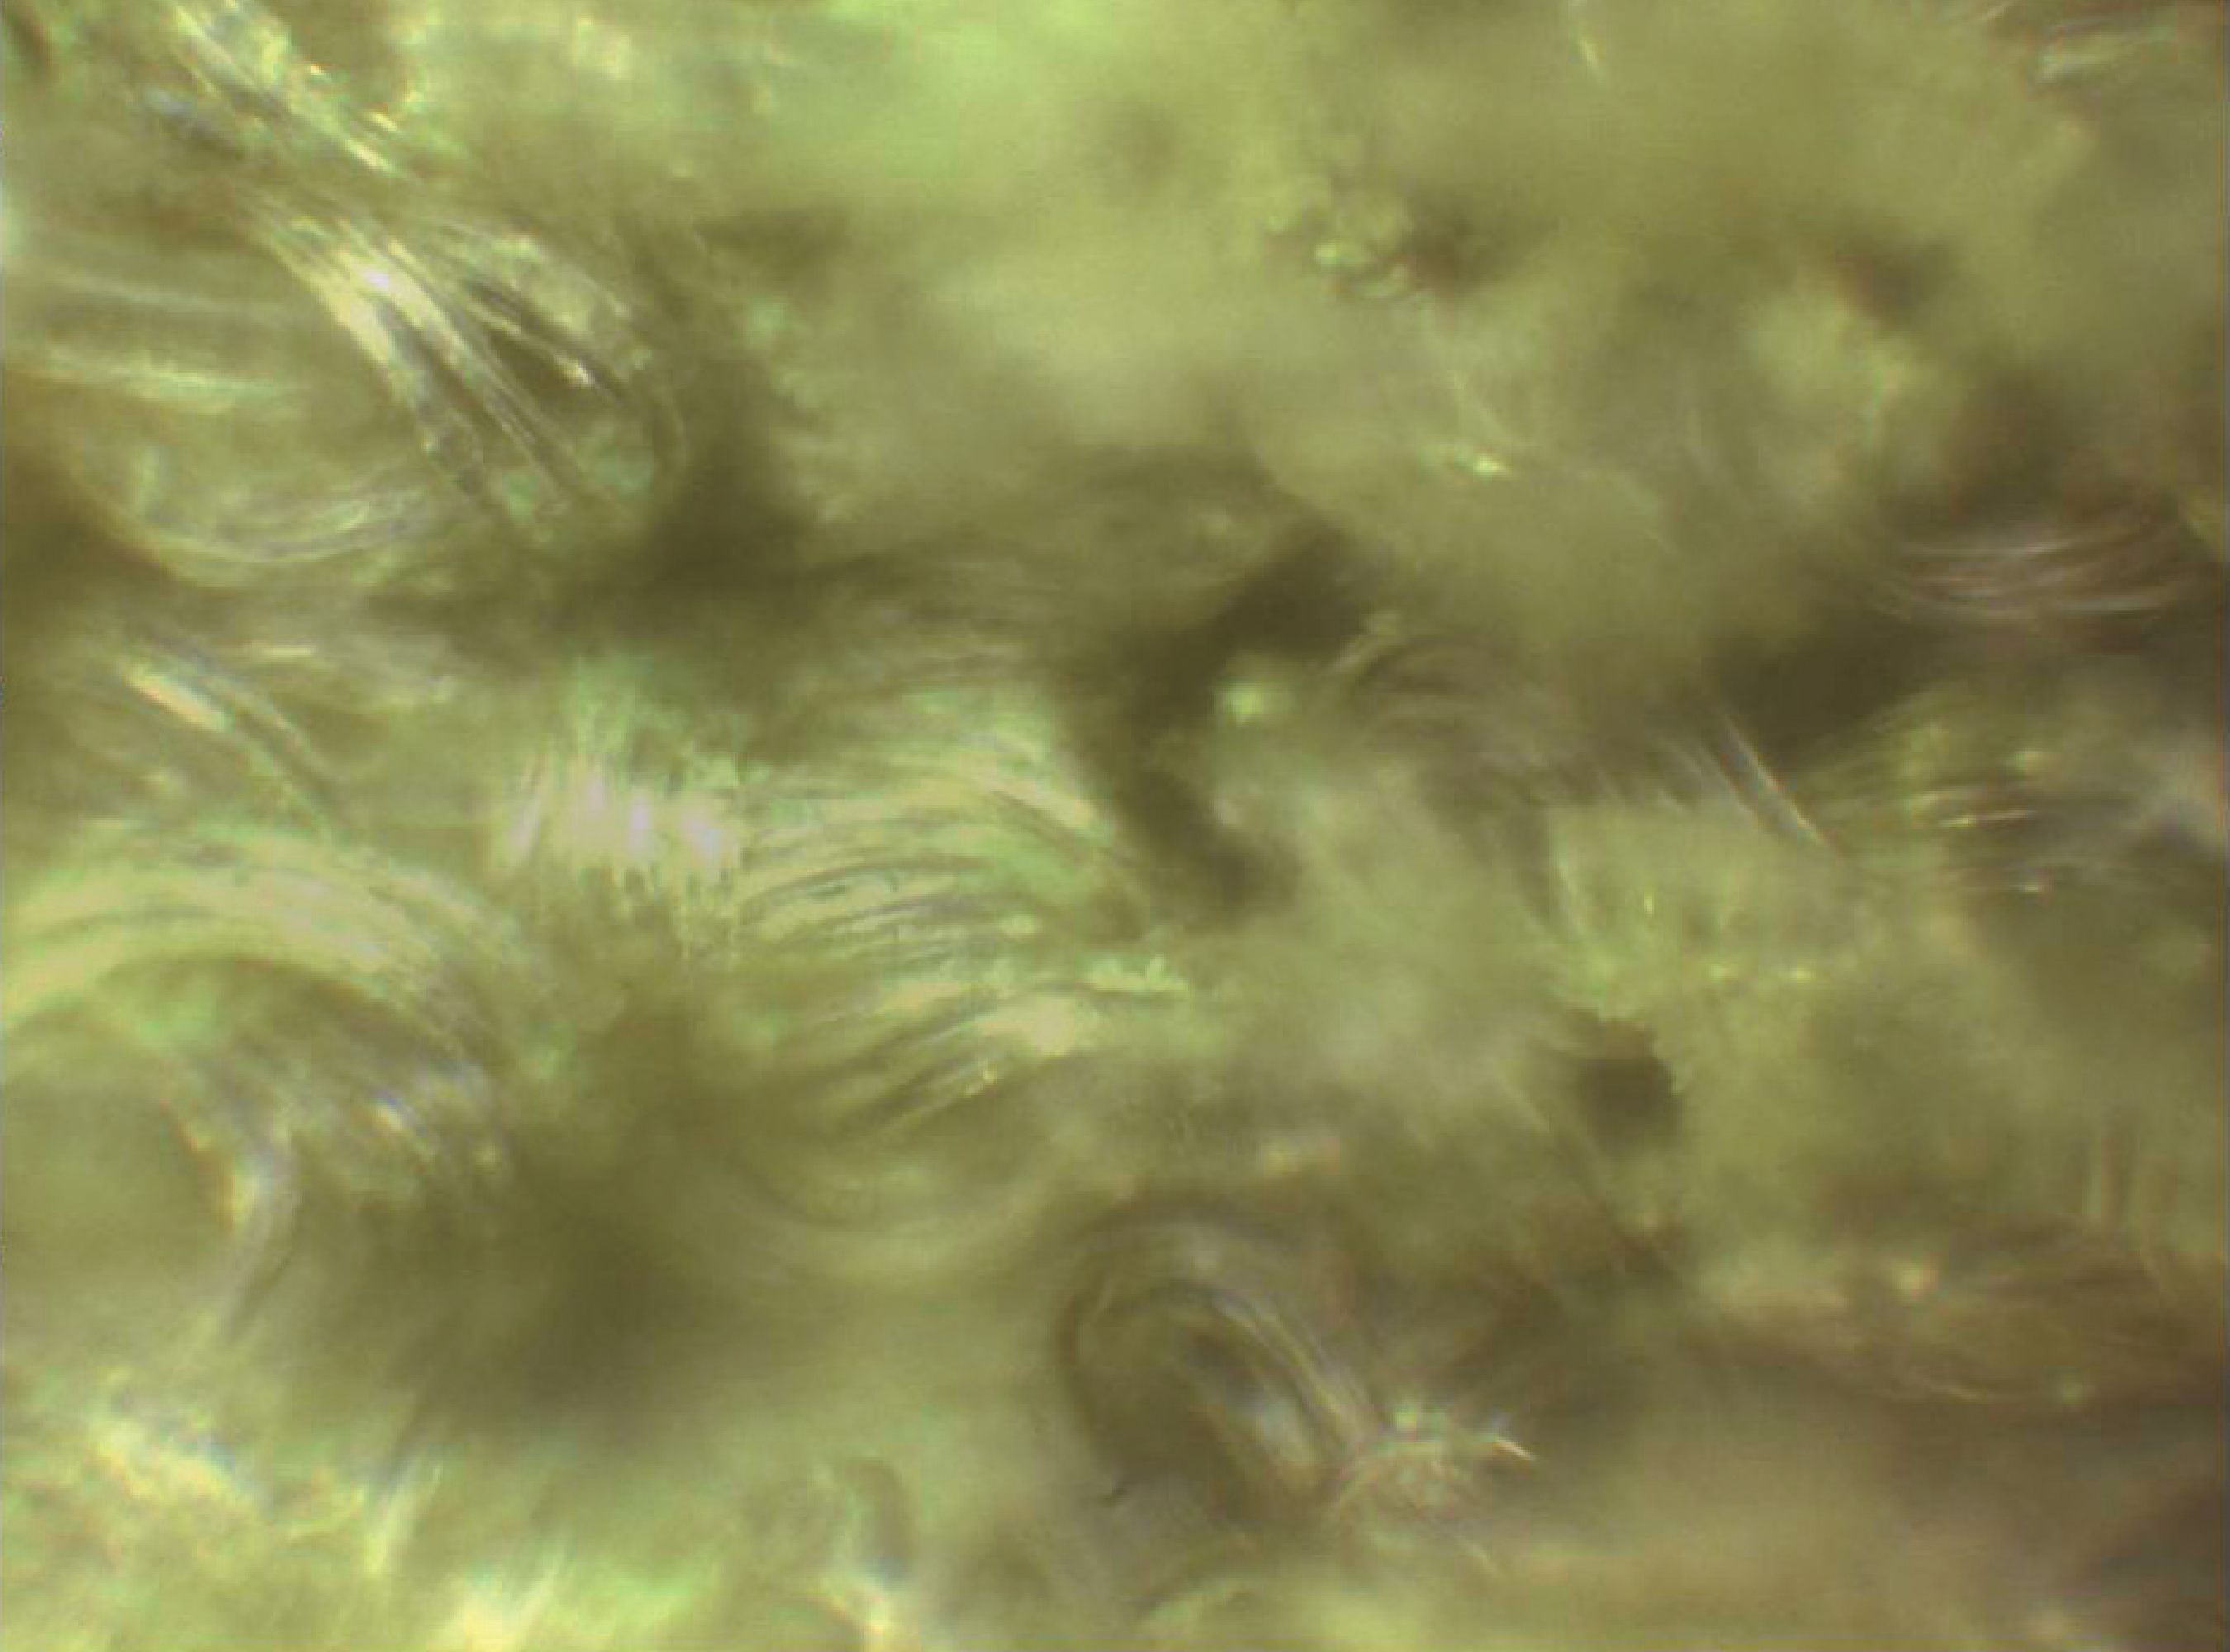
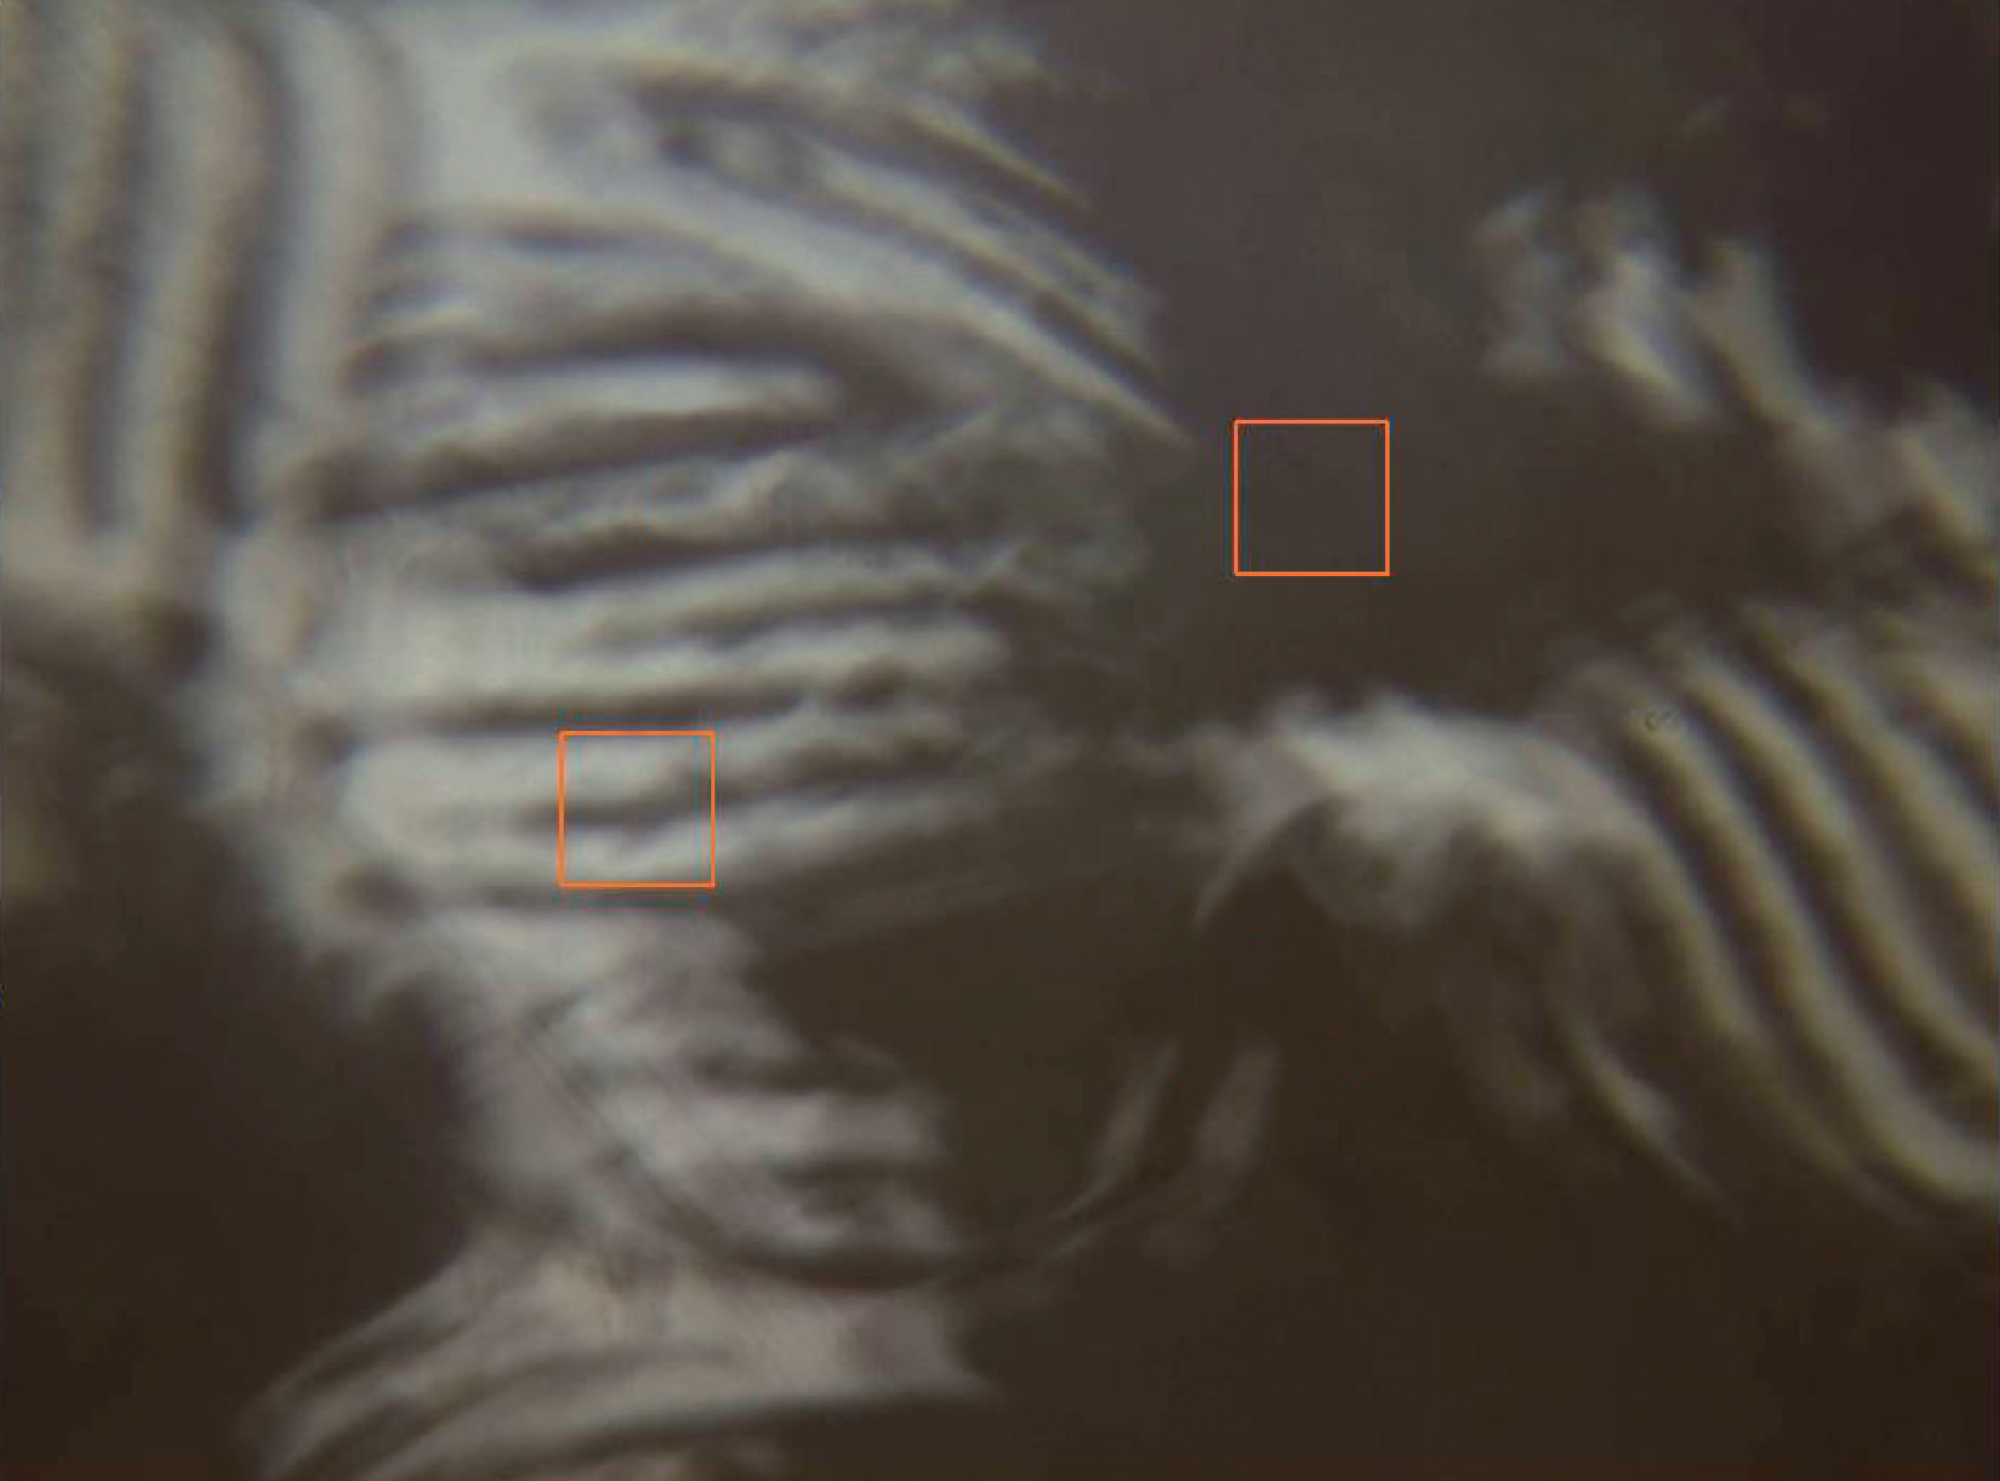
The ClearView™ ATR objectives allow both viewing of the sample through the crystal and ATR spectral measurement by simply moving the prism position (up and down). ATOS allows the aperture to select a specific area of the sample while viewing the entire area in contact with the crystal. In the application below, a mixed fiber was measured around the striated area in contact with the crystal. The spectra taken at two different measurement points show that the sample is composed of a mixture of nylon (light area) and acrylic (darker area).

Before Image After Image

Observation View (before contact)

View of the Measurement Position (after contact)

Software

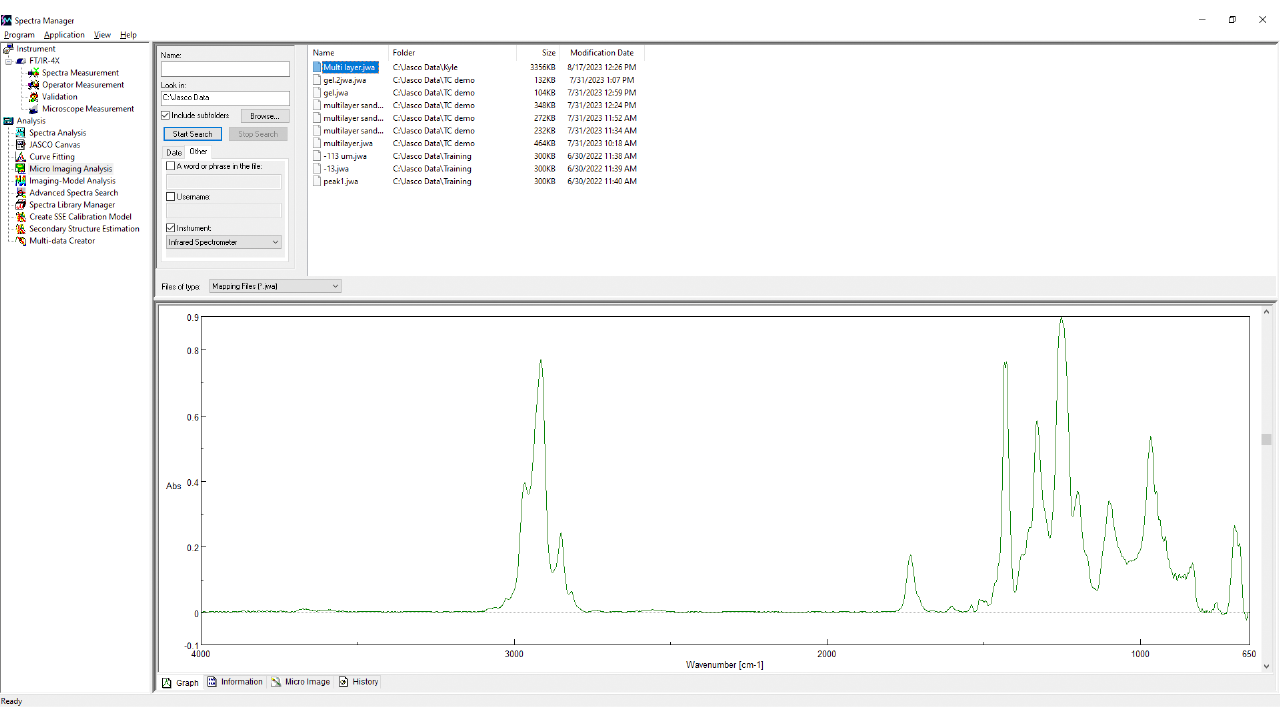
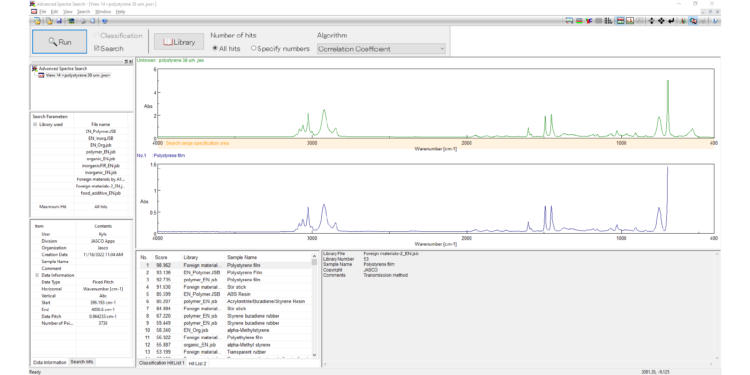
Spectra Manager™ is a cross-platform suite of molecular spectroscopy software for designing experimental methods, acquiring data, and processing results. This comprehensive package for controlling the entire range of molecular spectroscopy instrumentation eliminates the need for multiple software packages. Use the Folder function to find files by folder directory or use the Search function to find files within a folder directory using search terms such as keywords, username, date created, or instrument type.
Spectra Manager™

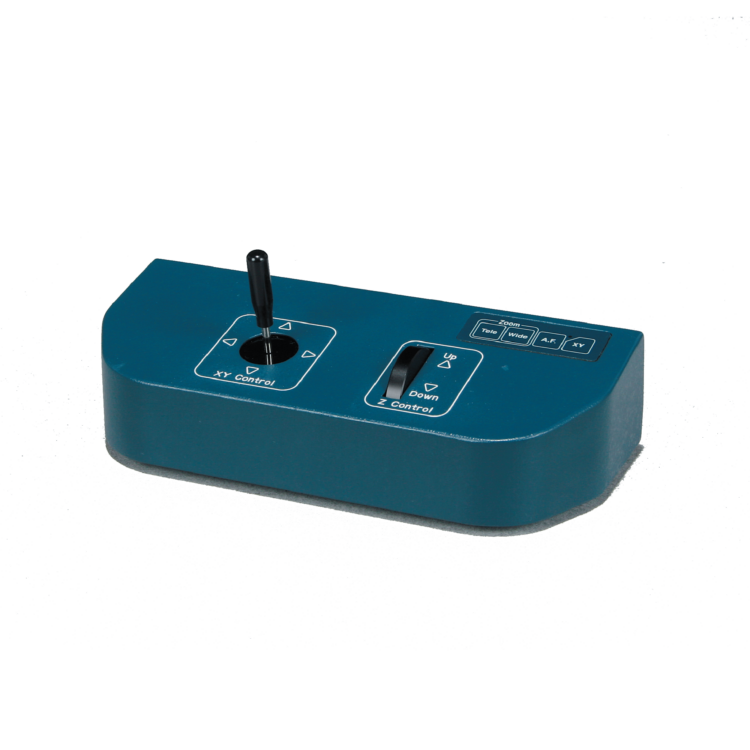
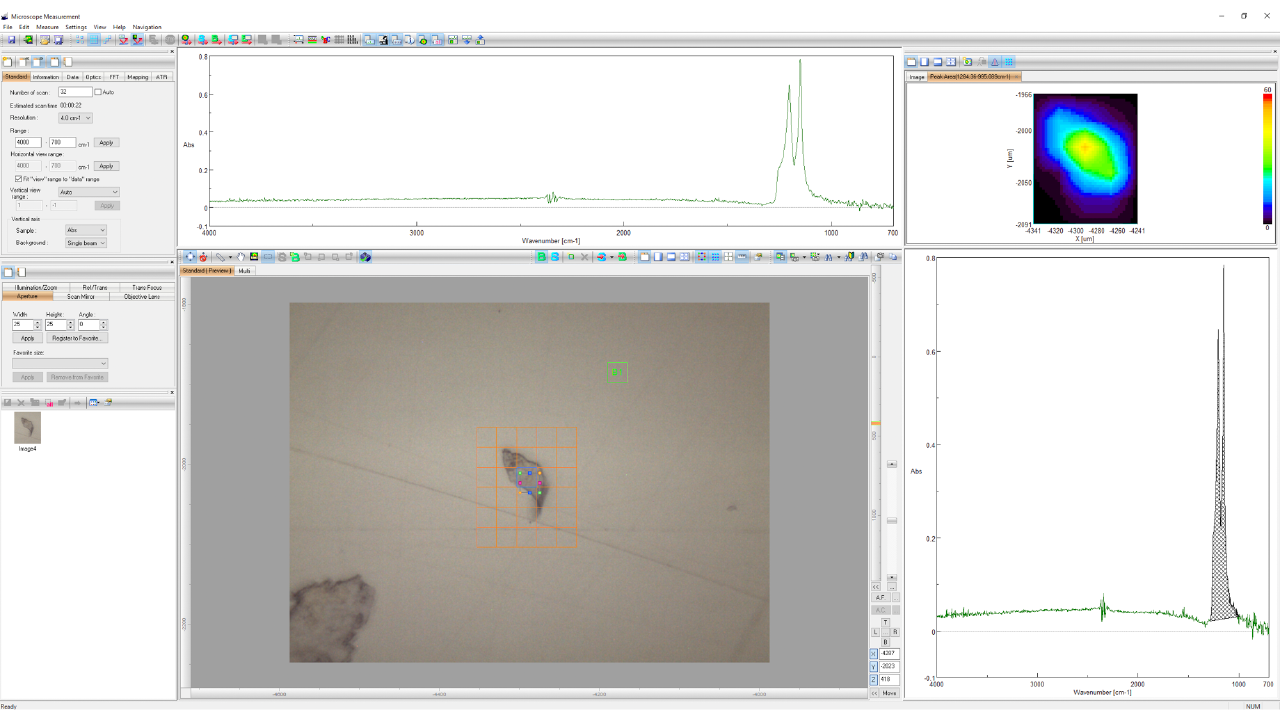
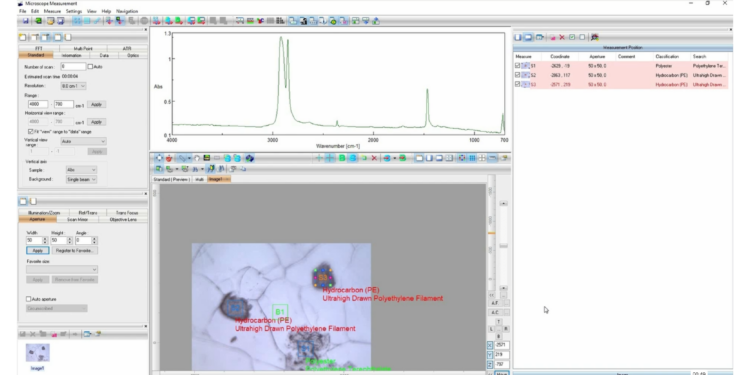
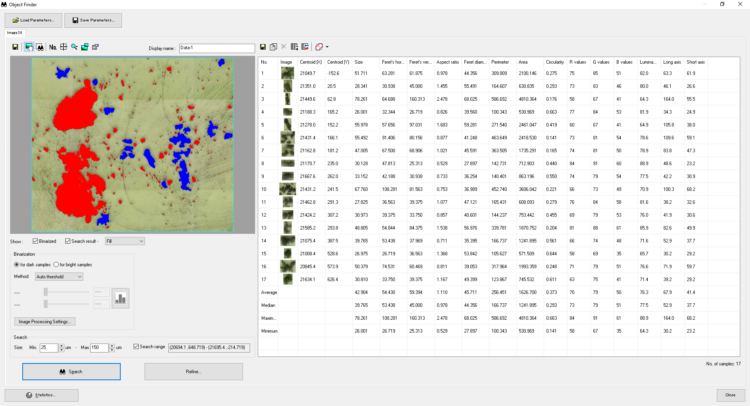
The IR Microscope Measurement program has five principal functions: Observation, Navigation, Imaging, Mapping, and Analysis. Navigate samples by double-clicking with the cursor, clicking and dragging the arrow cursor, using the joystick, select a thumbnail, select from the sub-map display, or using the multi-window display. Samples can be viewed as a single field image or a multi field composite image, which uses a matrix collected from multiple single field images taken automatically with the XYZ stage. IQ Monitor surveys the sample spectroscopically assessing measurement points, which can then be registered for automatic measurement with IQ Mapping. Acquired spectra, together with a functional group mapping, can be displayed in real-time. The spectral data and optical images are saved together in a single file, which can then be opened in the IR Microscope Analysis software for further analysis.

IR Microscope Measurement Software

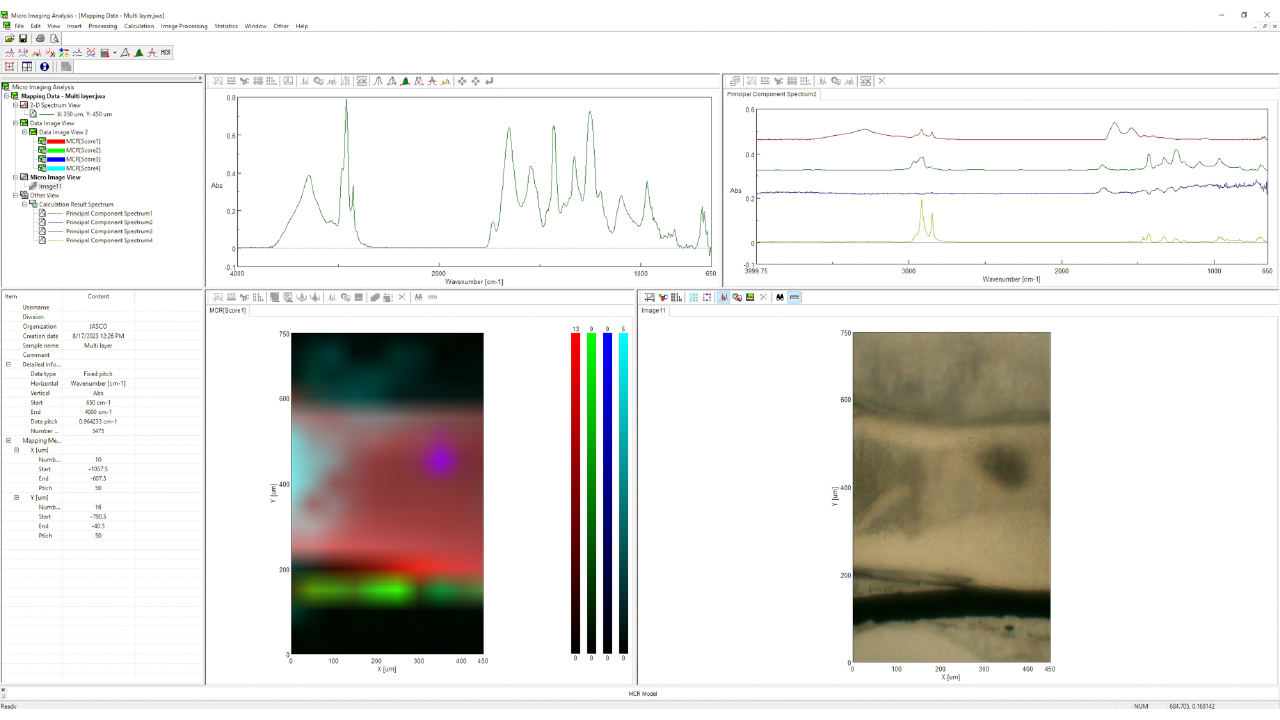
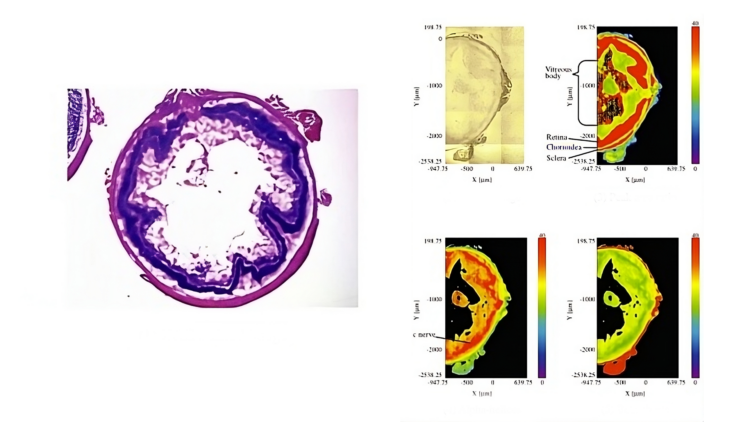
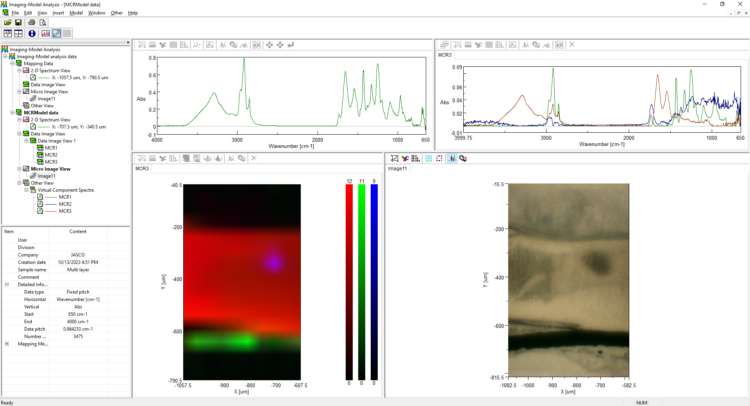
The Spectra Manager™ Micro Imaging Analysis program has many data processing functions for spectral analysis,  as well as tools for creating and viewing chemical images. The user can easily create a chemical image from a spectrum using the peak height/area/FWHM etc. to identify and visualize the distribution of functional groups.

IR Microscope Analysis Software

Peer-Reviewed Articles